As a new Camunda user, I am actively learning the wide toolset the product has to offer and understanding its impact on my new role at Camunda. While navigating through the Camunda Academy tutorials, my curiosity prompted me to explore all of Camunda’s components, leading me to discover Optimize. As a developer, I was hesitant at first to learn more about a feature that is primarily designed for business logic, but immediately saw how developers can leverage its features to enhance their development process and gain valuable information. This blog post will guide you through my findings as I learn more about Camunda and Optimize, using a simple trivia game as a practical illustration.
Error and Incident Optimization
One of the key features of Optimize is its ability to help developers optimize their processes to produce fewer errors in the long term. By leveraging premade reports, developers can identify incident hotspots and bottlenecks using heatmaps.
When adding a “Locate incident hotspots on a heatmap” template to an Optimize dashboard, developers can produce a visual representation of incidents based on both the resolution duration—how long it takes to resolve a specific issue—and by count—how many incidents occurred. By hovering over any task on the heatmap, developers can quickly analyze the duration and frequency of incidents. Additionally, filters can be applied to narrow down the data, such as by date and time.
Looking at our trivia game example, the heatmap can display the average time each trivia game spends at a specific task, in this case getting a hint from OpenAI. However, if this task was attached to a specific piece of code, developers can easily identify where there may be issues, like a bug in the code or a service that is down.
Another useful template in Optimize is the “locating bottlenecks” report. This heatmap showcases the average time spent on each part of a process.
For example, in the trivia game, answering questions and displaying messages took the longest amount of time. By analyzing this data in their product, developers can identify potential areas of improvement or automation. This information can help optimize the code and improve the overall user experience.
Creating Custom Reports
In addition to pre-built templates, Optimize allows developers to create their own custom reports. With a blank report, developers have the freedom to display any data they desire. For instance, the number of categories played in the trivia game can be showcased.
It’s not surprising to see that science/nature was our top category at a developer conference! This provides a comprehensive overview of the process’s performance and user preferences, as well as information about specific variables to make sure they’re producing the correct values.
In-depth Process Analysis
Optimize offers an analysis tab that provides additional insights into data and performance.
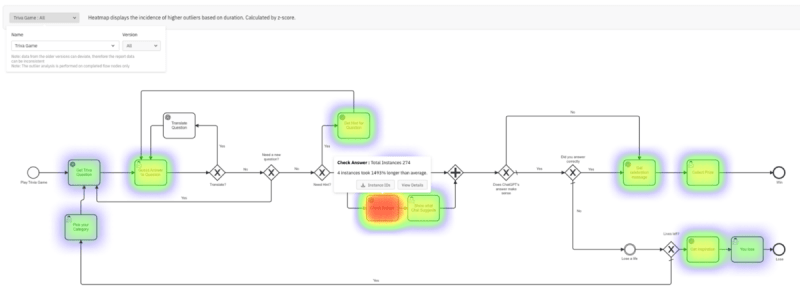
In the “Task Analysis” tab, developers can explore heatmaps that highlight outliers, indicating process instances that deviate from the average, which helps identify potential issues or inefficiencies in the process. From there, the instance IDs and more details can help developers dive into issues about specific tasks or parts of the process. Using the task analysis can be helpful to ensure new versions of a process runs similarly, as well as tracking improvements between versions.Similarly, the “Branch Analysis” tab provides the probability of instances following a desired path.
For example, in the trivia game, developers can analyze how many players who received hints were able to reach the winning path. These insights can guide further improvements and optimizations.
Optimize also offers a machine learning-ready data set, enabling developers to export and analyze their data using machine learning techniques. This means the data is already formatted and structured to align with machine learning algorithms to make predictions for future instances based on existing instances. The machine learning-ready data set simplifies the process of integrating Optimize with machine learning models and allows for more advanced analysis and predictions.
Let’s Review
No matter what type of developer you are—whether you’re an enterprise professional, a startup enthusiast, an engineering manager, or just starting your coding journey—Optimize offers a diverse range of insights that cater to your specific needs.
- Efficient Issue Resolution : By utilizing Optimize’s error and incident optimization features, developers can identify and address bottlenecks and issues efficiently.
- Comprehensive Performance Views: Custom reports and dashboards provide a comprehensive view of the application’s performance and user interactions.
- In-Depth Analysis for Improvement : The in-depth analysis features enable developers to gain deeper insights into the data and identify areas for further improvement.
Overall, Optimize empowers developers to improve their code, improve user experiences, and drive better business outcomes. For a visual exploration of these capabilities, don’t forget to check out our video overview. Feel free to engage in discussions and share your experiences in the Optimize forum category—it’s a great platform for further insights and community collaboration. For additional resources and detailed guides, explore the following links:
- Camunda Academy
- Optimize Docs
- Presentation: Optimize Re-Introduced – Why starting with Optimize was never that easy — 3 Use Cases you have to know
- Video: How Developers Can Make the Most of Camunda Optimize
The post From Insights to Action: Harnessing Camunda Optimize for Effective Development appeared first on Camunda.


