This is a short write up on the exercise of inserting batches of Kafka Records into CockroachDB using Confluent's JDBC Sink Connector, a 'no-code' solution for data ingestion.
An example on how to setup the pipeline locally using Docker is documented in this blog post.
The GitHub repository referenced in this write up is fabiog1901/kafka2cockroachdb.
The pipeline is very simple:
- A python script generates data that gets ingested into a Kafka Topic within the Kafka Broker.
- The Topic is partitioned.
- Exactly 1 Kafka Connect task is started for each partition.
- The Task reads from the topic partition and inserts into CockroachDB by making a conneciton through the Load Balancer.
Test Infrastructure and Components Setup
Infrastructure was deployed using Ansible on Google Cloud VMs:
- Single node Confluent Platform (Kafka broker and Kafka Connect) on
n2-standard-16instance type. - 3 nodes CockroachDB cluster using the
n2d-standard-8|16|32instance types. Each VM was provisioned with 1 x 2.5TB Persistent SSD (pd-ssd) volume. - Single node Load Balancer instance running HAProxy.
The main Kafka backend was installed using the Ansible Playbooks for Confluent Platform.
The CockroachDB cluster and the HAProxy load balancer instance were installed using the fabiog1901.cockroachdb Ansible Collection.
The test was run executing convenience Python script play.py.
The script coordinates the execution of 4 Ansible Playbooks:
-
kafka.yaml- Provision and prepare the Kafka cluster. -
cockroachdb.yaml- Provision and prepare the CockroachDB cluster. -
kafka-producer.yaml- Prepare Kafka broker and start the Kafka producer. -
kafka-consumer.yaml- Run the Kafka consumer i.e. Kafka Connect.
Kafka Producer
To load data into the Kafka Topic we used a simple generator written in Python, libs/gen.py.
The generator leverages the confluent-kafka package for publishing Avro records of about 60 fields.
The generator is started and let run for 20 minutes before any consumer process is started, so that the Topic is always well filled with records.
Kafka Consumer
Kafka Connect was configured with the JDBC Sink Connector, however, a custom kafka-connect-jdbc-10.6.1.jar file was used: the only change made to the original version was to set autocommit=true for the SQL transactions, here.
This change is important as it allows statements to be executed implicitly, saving therefore a roundtrip for the commit message.
The Jar file can be found in the libs directory.
Similarly, a custom PostgreSQL JDBC Driver was used, allowing for batch statements to be larger than 128 records, see here.
The result is we can now test with multi-value INSERT statements that have more than 128 values.
The custom driver Jar file is also in the libs directory.
CockroachDB Cluster
The 3 nodes CockroachDB cluster runs version 22.2.5|6.
The database was seeded with approximately 0.5TB of data.
The data was generated externally and imported from Google Cloud Storage directly into the database.
CockroachDB stored the data with a Replication Factor of 3, the default.
This implies that every single node has a full copy of the entire dataset.
See custom settings and DDL statements executed in file libs/s.sql.
Test Description
We tested with 3 instance types, multiple Kafka topic partitions and batch sizes.
Script play.py was used to run the tests.
In short, for each instance type, we cycled through all partitions, and for each partition, we cycled through all batch sizes.
On each partition cycle, the JDBC Sink Connector was created with tasks.max set to the same number as the partition count.
Here, a task is a process that creates a database connection, consumes records from the assigned topic partition, prepares the INSERT statement and finally sends it to CockroachDB for execution.
On each batch size cycle, the JDBC Sink Connector was created with batch.size and consumer.override.max.poll.records set to the current batch_size value.
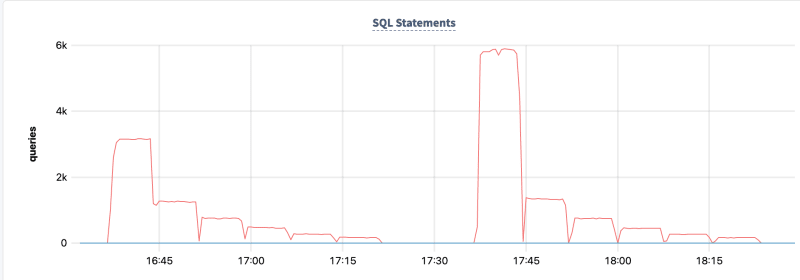
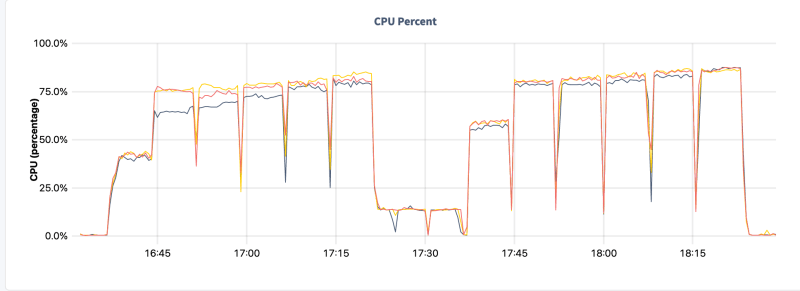
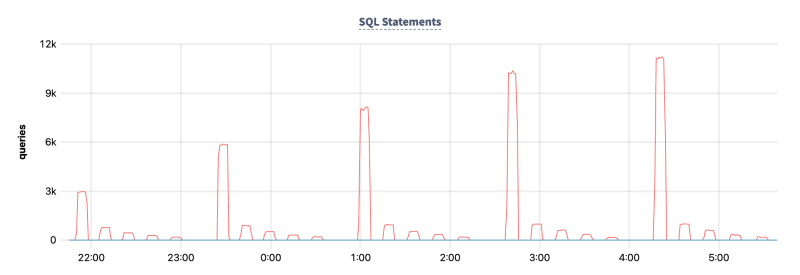
Results of transaction latency, throughput (TPS) and CPU util are shown below for each of the test cases.
per_stmt_latency_ms is a computed value, derived by dividing txn_latency_ms by batch_size.
Using n2d-standard-8
| total_vcpus | k_partitions | batch_size | tps | cpu_util_pct | txn_latency_ms | per_stmt_latency_ms |
|---|---|---|---|---|---|---|
| 24 | 18 | 1 | 3160 | 40 | 3.0 | 3.00 |
| 24 | 18 | 8 | 9984 | 70 | 10.7 | 1.34 |
| 24 | 18 | 16 | 12064 | 70 | 19.3 | 1.21 |
| 24 | 18 | 32 | 14457 | 75 | 32.7 | 1.02 |
| 24 | 18 | 64 | 15920 | 75 | 59.9 | 0.94 |
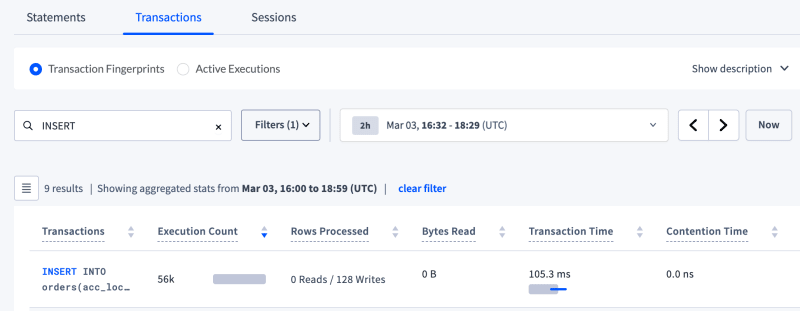
| 24 | 18 | 128 | 17820 | 80 | 105.3 | 0.82 |
| 24 | 36 | 1 | 5839 | 60 | 3.3 | 3.30 |
| 24 | 36 | 8 | 10653 | 80 | 22.4 | 2.80 |
| 24 | 36 | 16 | 11854 | 80 | 41.7 | 2.61 |
| 24 | 36 | 32 | 13923 | 80 | 71.4 | 2.23 |
| 24 | 36 | 64 | 15765 | 85 | 126.9 | 1.98 |
| 24 | 36 | 128 | 17684 | 85 | 219.0 | 1.71 |
Overview Dashboard -> SQL Statements
Hardware Dashboard -> CPU Utilization
SQL Activity --> Transaction page - data for the 18 partitions test
Using n2d-standard-16
| total_vcpus | k_partitions | batch_size | tps | cpu_util_pct | txn_latency_ms | per_stmt_latency_ms |
|---|---|---|---|---|---|---|
| 48 | 18 | 1 | 2955 | 20 | 3.3 | 3.30 |
| 48 | 18 | 16 | 12104 | 65 | 19.0 | 1.19 |
| 48 | 18 | 32 | 13824 | 65 | 35.0 | 1.09 |
| 48 | 18 | 64 | 16187 | 70 | 61.0 | 0.95 |
| 48 | 18 | 128 | 18558 | 75 | 105.0 | 0.82 |
| 48 | 36 | 1 | 5846 | 35 | 3.3 | 3.30 |
| 48 | 36 | 16 | 14061 | 70 | 35.0 | 2.19 |
| 48 | 36 | 32 | 16187 | 75 | 63.0 | 1.97 |
| 48 | 36 | 64 | 18700 | 75 | 109.0 | 1.70 |
| 48 | 36 | 128 | 21231 | 80 | 188.0 | 1.47 |
| 48 | 54 | 1 | 8070 | 50 | 3.8 | 3.80 |
| 48 | 54 | 16 | 14788 | 75 | 52.0 | 3.25 |
| 48 | 54 | 32 | 16641 | 75 | 94.0 | 2.94 |
| 48 | 54 | 64 | 20007 | 80 | 154.0 | 2.41 |
| 48 | 54 | 128 | 20485 | 80 | 298.0 | 2.33 |
| 48 | 72 | 1 | 10237 | 60 | 4.1 | 4.10 |
| 48 | 72 | 16 | 15456 | 75 | 67.0 | 4.19 |
| 48 | 72 | 32 | 18817 | 80 | 111.0 | 3.47 |
| 48 | 72 | 64 | 19569 | 80 | 212.0 | 3.31 |
| 48 | 72 | 128 | 18393 | 80 | 441.0 | 3.45 |
| 48 | 90 | 1 | 11153 | 65 | 5.0 | 5.00 |
| 48 | 90 | 16 | 15526 | 75 | 85.0 | 5.31 |
| 48 | 90 | 32 | 18632 | 75 | 141.0 | 4.41 |
| 48 | 90 | 64 | 18488 | 80 | 277.0 | 4.33 |
| 48 | 90 | 128 | 18043 | 80 | 569.0 | 4.45 |
Overview Dashboard -> SQL Statements
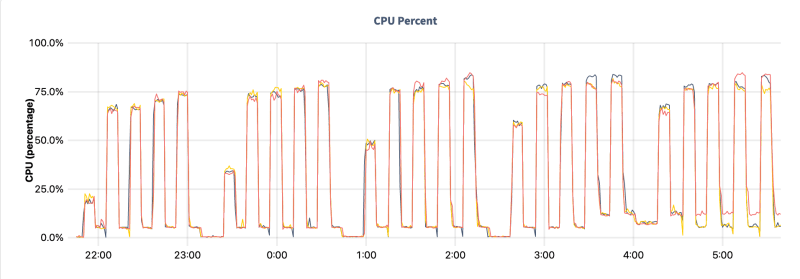
Hardware Dashboard -> CPU Utilization
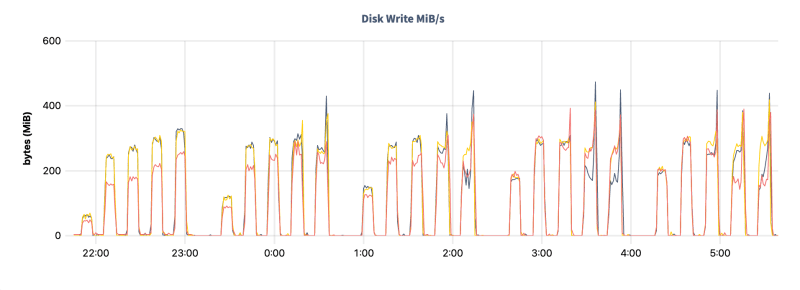
Hardware Dashboard -> Disk Write MiB/s
Replication Dashboard -> Leaseholders per Node

Using n2d-standard-32
| total_vcpus | k_partitions | batch_size | tps | cpu_util_pct | txn_latency_ms | per_stmt_latency_ms |
|---|---|---|---|---|---|---|
| 96 | 36 | 1 | 8237 | 20 | 3.0 | 3.00 |
| 96 | 36 | 32 | 35012 | 65 | 27.5 | 0.86 |
| 96 | 36 | 64 | 39455 | 65 | 48.7 | 0.76 |
| 96 | 36 | 128 | 42938 | 70 | 88.7 | 0.69 |
| 96 | 36 | 256 | 46214 | 75 | 153.3 | 0.60 |
| 96 | 54 | 1 | 11559 | 35 | 3.2 | 3.20 |
| 96 | 54 | 32 | 34039 | 70 | 44.4 | 1.39 |
| 96 | 54 | 64 | 37177 | 70 | 93.5 | 1.46 |
| 96 | 54 | 128 | 36003 | 75 | 160.8 | 1.26 |
| 96 | 54 | 256 | 37501 | 80 | 292.6 | 1.14 |
| 96 | 72 | 1 | 14253 | 40 | 3.4 | 3.40 |
| 96 | 72 | 32 | 32578 | 70 | 63.3 | 1.98 |
| 96 | 72 | 64 | 32340 | 75 | 129.2 | 2.02 |
| 96 | 72 | 128 | 31045 | 80 | 260.0 | 2.03 |
| 96 | 72 | 256 | 30034 | 80 | 489.4 | 1.91 |
| 96 | 90 | 1 | 16325 | 50 | 3.8 | 3.80 |
| 96 | 90 | 32 | 30576 | 70 | 86.9 | 2.72 |
| 96 | 90 | 64 | 30277 | 75 | 169.2 | 2.64 |
| 96 | 90 | 128 | 29890 | 80 | 330.0 | 2.58 |
| 96 | 90 | 256 | 29235 | 80 | 668.2 | 2.61 |
Hardware Dashboard -> CPU Utilization - Sometimes load is slightly uneven, even if the workload is perfectly distributed

Considerations
- It is generally recommended to keep the cluster CPU Utilization at around 50% as to have headroom for sudden spikes, node failures, and background database operations such as backups, CDC feeds, import/export jobs, etc.
- Write throughput varies greatly depending on the hardware utilized. See public clouds hardware recommendation for CockroachDB in the Cloud Report.
- Transaction latency varies in multi-region clusters, as you can expect transactions have to ensure at least 1 out of region replica has to be kept in sync.
- Other factors impacting latency include, but are not limited to: read/write ratio, count of secondary indexes, database topology, client location, record size.
Next
In this project, I have tweaked both the driver and the kafka-connect-jdbc connector. For my next tests, I like to:
- Explore best ways to optimize the Kafka Connector, possibly working along with the Confluent engineering team.
- Replace the standard JDBC PostgreSQL Driver with the
cockroachdb-jdbcdriver, kindly developed and maintained by Kai Niemi.


