If you've ever needed to understand the details of a web page's interaction with network resources, you're likely familiar with the Network tab of you browser.
In this post I'm going to describe 3 (possibly) lesser known features related to the Chrome Network tab.
1. Customizing the view
Once you access the Chrome Network tab you are presented with the standard view. This is what I see when I view the Network tab for the dev.to home page:

As you can see above, the dev.to page has a number of resource types, including jpeg, script, xhr, png, etc. You can limit your view to a single resource type by selecting that type in the filter ribbon. For example, this view is filtered to display script resources:

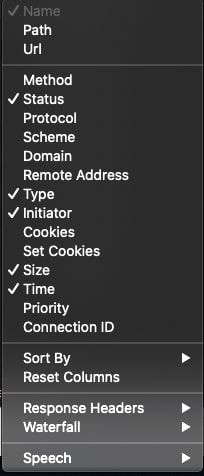
OK that's relatively basic and you might know that already, but did you know you can view additional data, edit the sort order, customize the view of the waterfall column, and more? All of this can be accomplished by right clicking on one of the resource columns and making your selections from the context-sensitive menu:

2. Capturing Screen Shots
In addition to the wealth of textual data available, you can also view screenshots of the page as it loads. To do that, just click the gear icon on the upper right. then check the "Show overview" and "Capture screenshots" checkboxes:

After making those changes and refreshing the page you'll see screen shots of the page as it loads:

You can click on an image to jump to the associated network activity below, or double-click the image to get a better look:

3. The HTTP Archive File
All of the details captured by Chrome can be saved to a file; an HTTP Archive File. This HAR file contains all the network details in JSON format.
Capturing this data in a file allows you to save details from a session, share with other team members, load into Chrome developer tools, or perform further analysis with 3rd party HAR analysis tools. In addition, tools like Gatling use a HAR file as input into a process for generating load test scripts. I talked about this in my Gatling post (shameless plug).
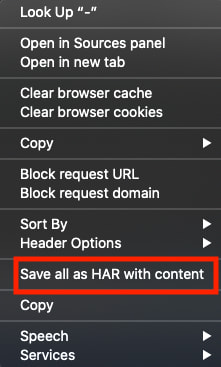
To save the Chrome session info to a HAR file, just right-click in the network traffic table and selected "Save all as HAR with content" from the context-sensitive menu:

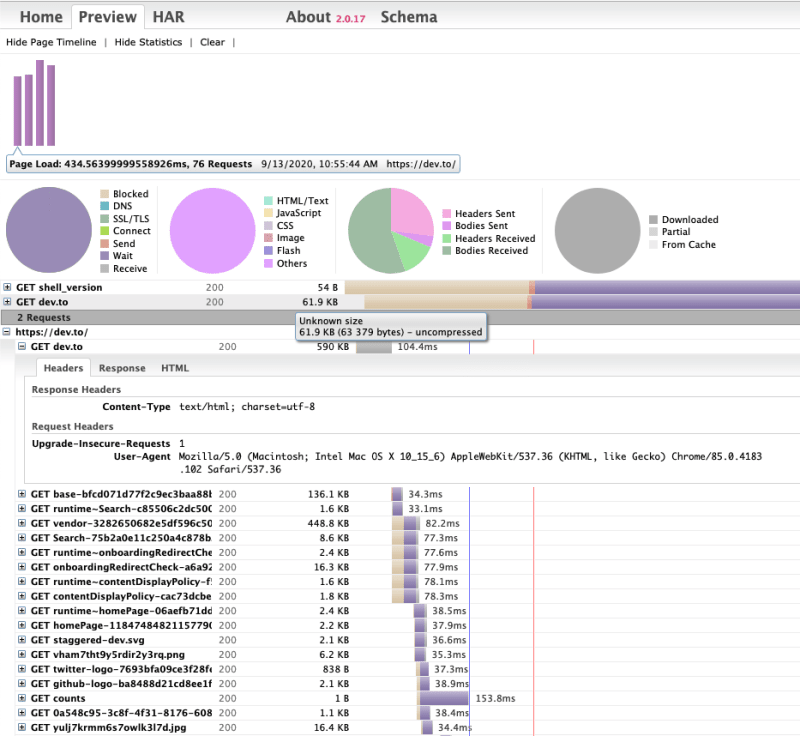
There are a number of online HAR viewers, but one I've used that I like can be found at http://www.softwareishard.com/har/viewer/
Drag your HAR file onto the page and you'll see an interactive visual of your HAR file:

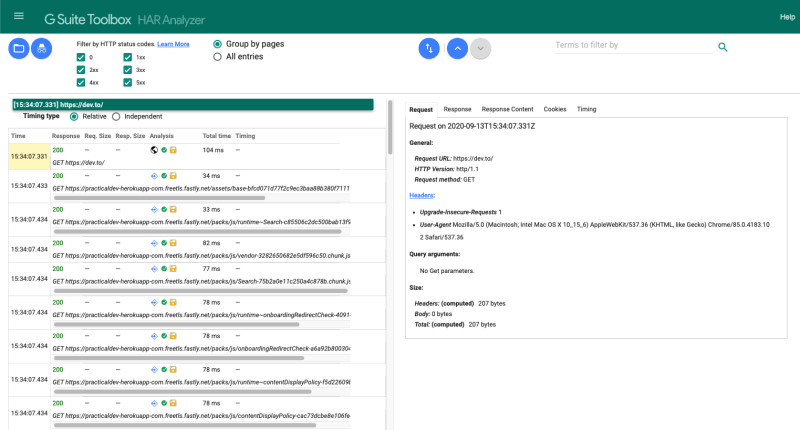
Of course Google has a HAR analyzer also:

Go ahead and explore and see what works for you.
Wrap-up
Chrome has plenty of other features available in the DevTools, and you can checkout out lots more at the Chrome DevTools page.
I hope you've learned something from this post. Maybe you have your own tips and tricks for Chrome DevTools? If so, feel free to mention them in the comments!
Happy browsing!


