Along with security, monitoring and observability have become important for applications. It is highly recommended to see how the application behaves when it is running in production. But it costs a lot to test and check things in production. It is always a good idea to see the application logs and traces before we deploy them. It helps you know any errors before they get into your customers' hands.
Today, we will see how to trace and instrument Node.js applications with OpenTelemetry and Jaeger.
What is OpenTelemetry?
 Source credits: DZone
OpenTelemetry is an open-source observability framework that is making a great buzz in the software industry these days. It helps organizations by providing a set of tools, APIs, and instrumentation libraries to enable the collection, generation, and export of telemetry data from software systems. OpenTelemetry is becoming a standard observability tool that helps in gathering metrics, traces and logs from the systems. This helps organizations to find errors way before they reach customers' hands.
With little effort, developers can see what's happening with their applications and services by setting up OpenTelemetry. It supports various programming languages, including JavaScript, Python, Java, Go, and .NET, making it versatile for different types of applications.
What is Jaeger?
 Source credits: Jaeger
Jaeger is an open-source distributed tracing platform built by Uber, which is now a part of the CNCF foundation. Jaeger has become a renowned name in distributed tracing and observability. Distributed tracing is when a company has adopted a microservices architecture, and it requires to have proper visibility over how connections are made between these microservices, networking aspects, etc.
Jaeger provides visibility into the flow of requests between different components in a distributed system, allowing developers and operations teams to understand how requests propagate and interact across various services. It enables the tracing of requests as they traverse through multiple microservices, providing insights into latency, bottlenecks, and errors.
Tutorial
- Initialize a new Node.js project by running the following command: ```
npm init -y
- Install the OpenTelemetry API and Node.js SDK packages by running the following command:
npm install @opentelemetry/api @opentelemetry/node
- Install the Jaeger exporter package by running the following command:
npm install @opentelemetry/exporter-jaeger
Instrument your Node.js application

- Create a new JavaScript file, for example, `index.js`, and add the following code to it.
const { NodeTracerProvider } = require('@opentelemetry/node');
const { SimpleSpanProcessor } = require('@opentelemetry/tracing');
const { JaegerExporter } = require('@opentelemetry/exporter-jaeger');
const { trace } = require('@opentelemetry/api');
// Set up the tracer provider and exporter
const provider = new NodeTracerProvider();
const exporter = new JaegerExporter({
serviceName: 'your-service-name',
// Set other configuration options as needed
});
// Create a span processor and register it with the tracer provider
const spanProcessor = new SimpleSpanProcessor(exporter);
provider.addSpanProcessor(spanProcessor);
// Set the tracer provider as the global tracer provider
provider.register();
// Perform a database query within a span
async function performDatabaseQuery() {
// Start a new span
const span = trace.getTracer('example').startSpan('database-query');
// Simulate a database query
const result = await executeDatabaseQuery();
// End the span
span.end();
return result;
}
// Simulated database query
function executeDatabaseQuery() {
// Simulate a delay
const delay = Math.random() * 1000;
return new Promise((resolve) => {
setTimeout(() => {
resolve('Query result');
}, delay);
});
}
// Entry point
async function main() {
// Perform a database query within a trace
const result = await performDatabaseQuery();
console.log(result);
}
// Run the application
main().catch((err) => {
console.error('An error occurred:', err);
process.exit(1);
});
In this example, we simulate performing a database query within a span. When you run the updated index.js file, it will generate traces for the database query operation and send them to Jaeger for visualization in the Jaeger UI.

In the serviceName field of the JaegerExporter configuration, you should replace 'your-service-name' with an appropriate name for your service.

- Run the Node.js application with the following command
node index.js
When you run the `index.js` file, the output will be the result of the simulated database query.

The exact output will vary because the simulated delay for the query result is random. However, it will be something similar to:

`Query result`

- Set up Jaeger
Running Jaeger locally using Docker
docker run -d --name jaeger \
-e COLLECTOR_ZIPKIN_HOST_PORT=:9411 \
-e COLLECTOR_OTLP_ENABLED=true \
-p 6831:6831/udp \
-p 6832:6832/udp \
-p 5778:5778 \
-p 16686:16686 \
-p 4317:4317 \
-p 4318:4318 \
-p 14250:14250 \
-p 14268:14268 \
-p 14269:14269 \
-p 9411:9411 \
jaegertracing/all-in-one:1.46
Now, you can simply open the Jaeger UI on http://localhost:16686.

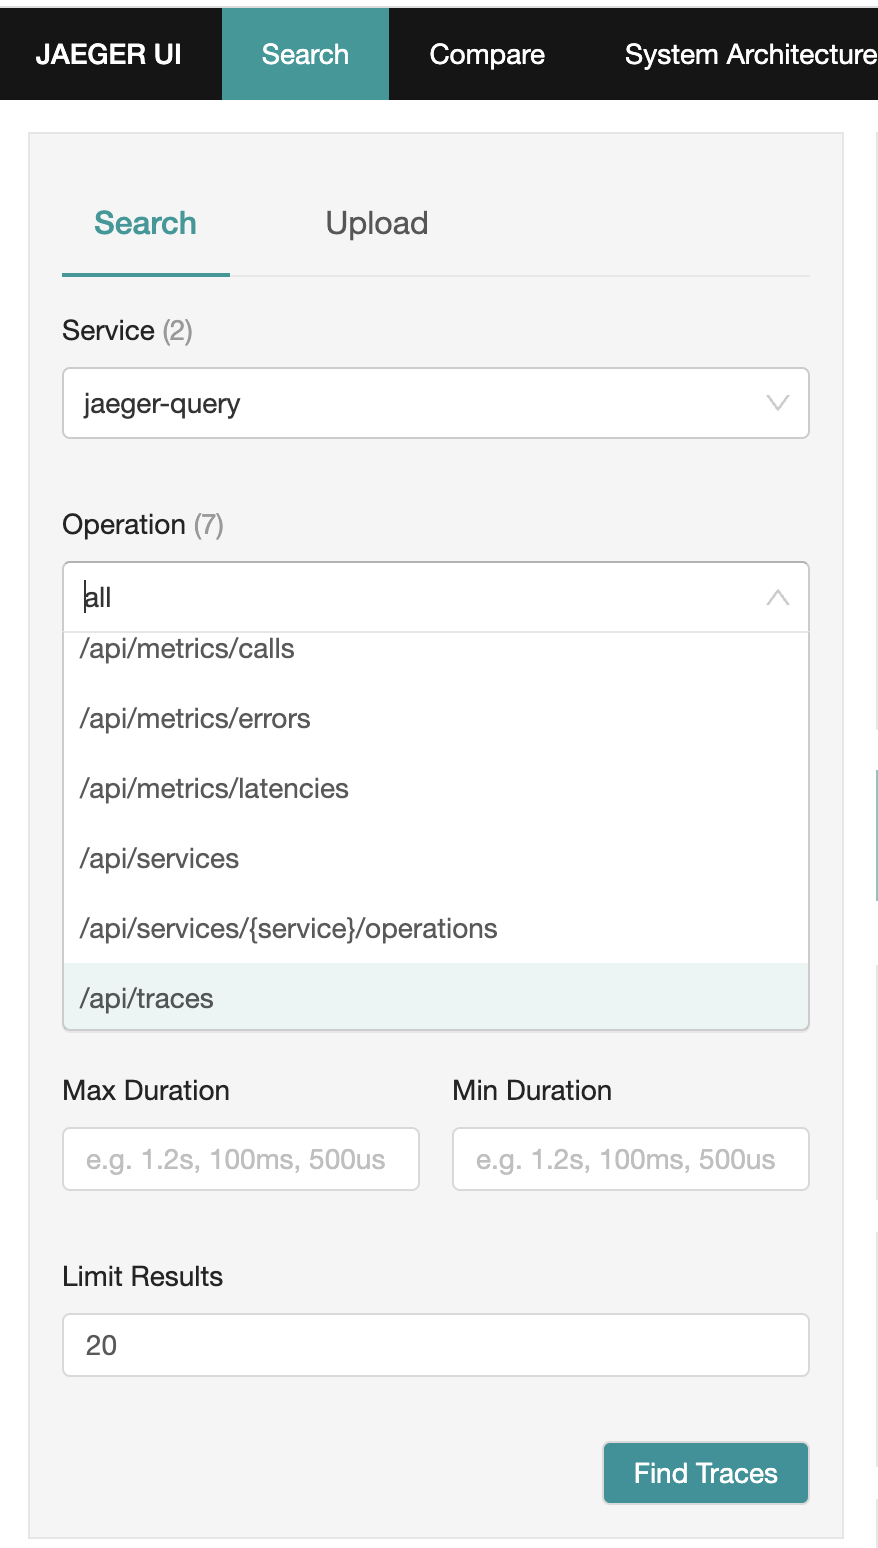
- Run the database query a couple of times and you can see the traces from the Jaeger UI.
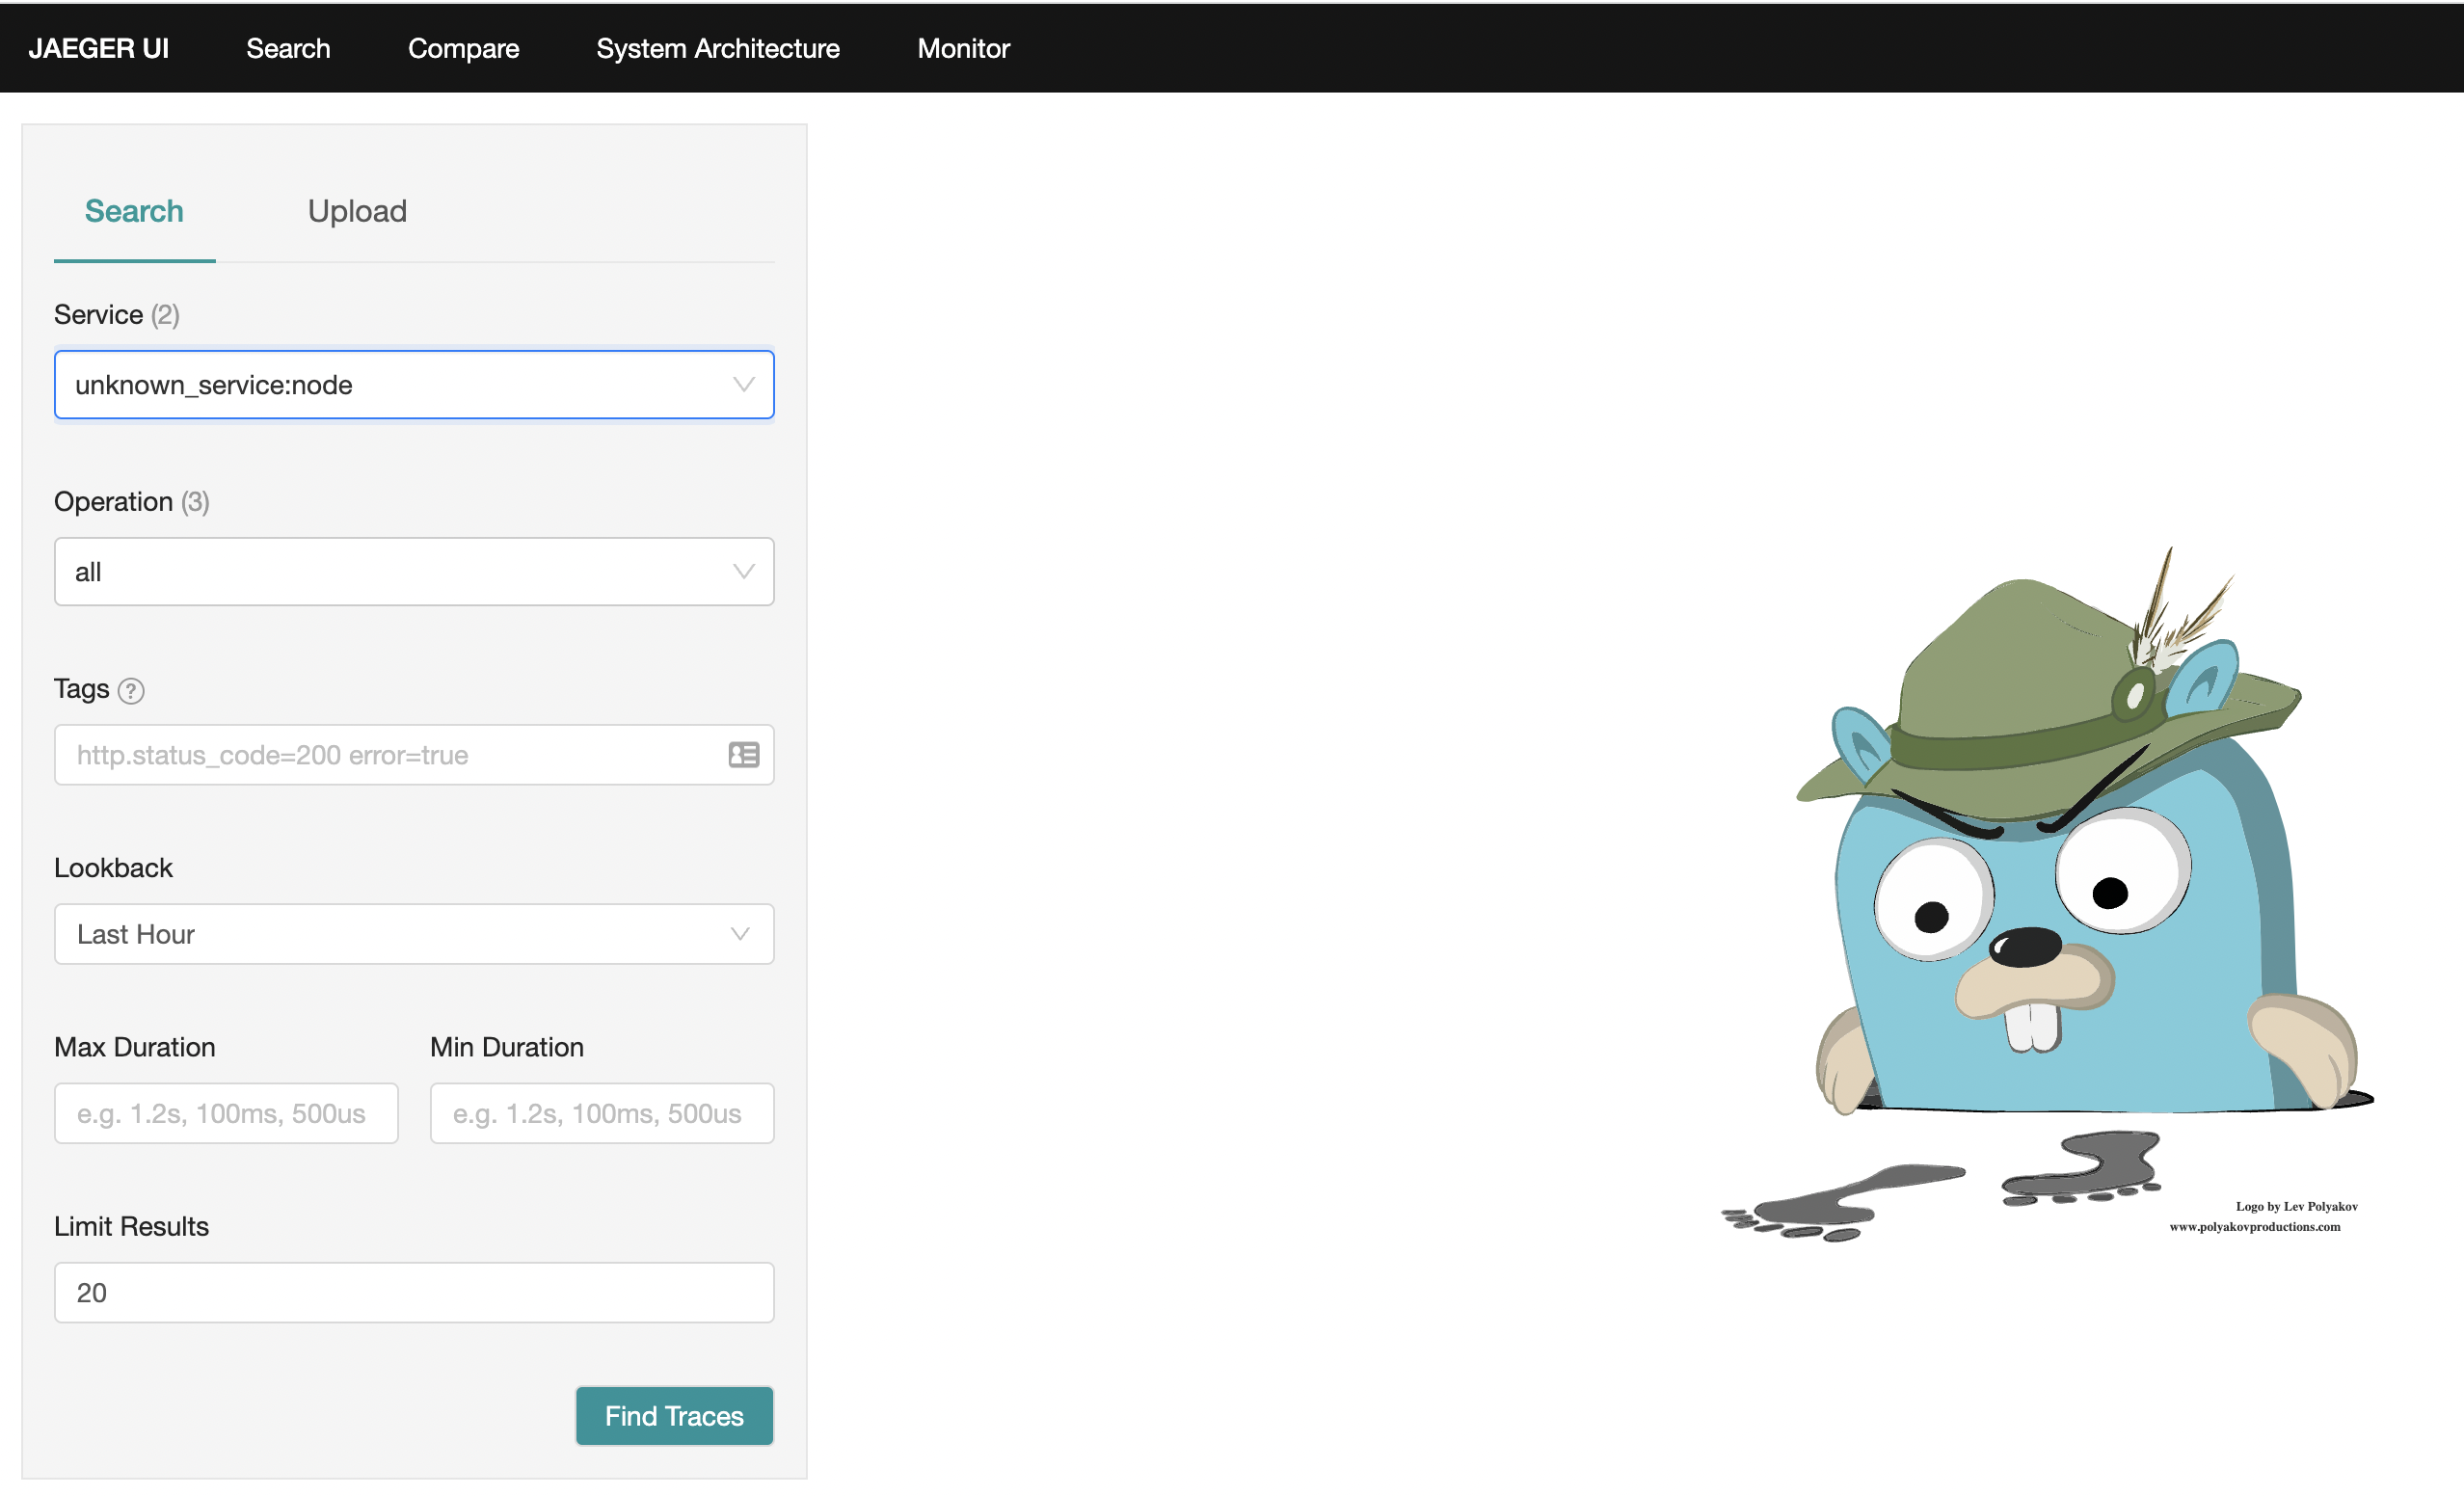
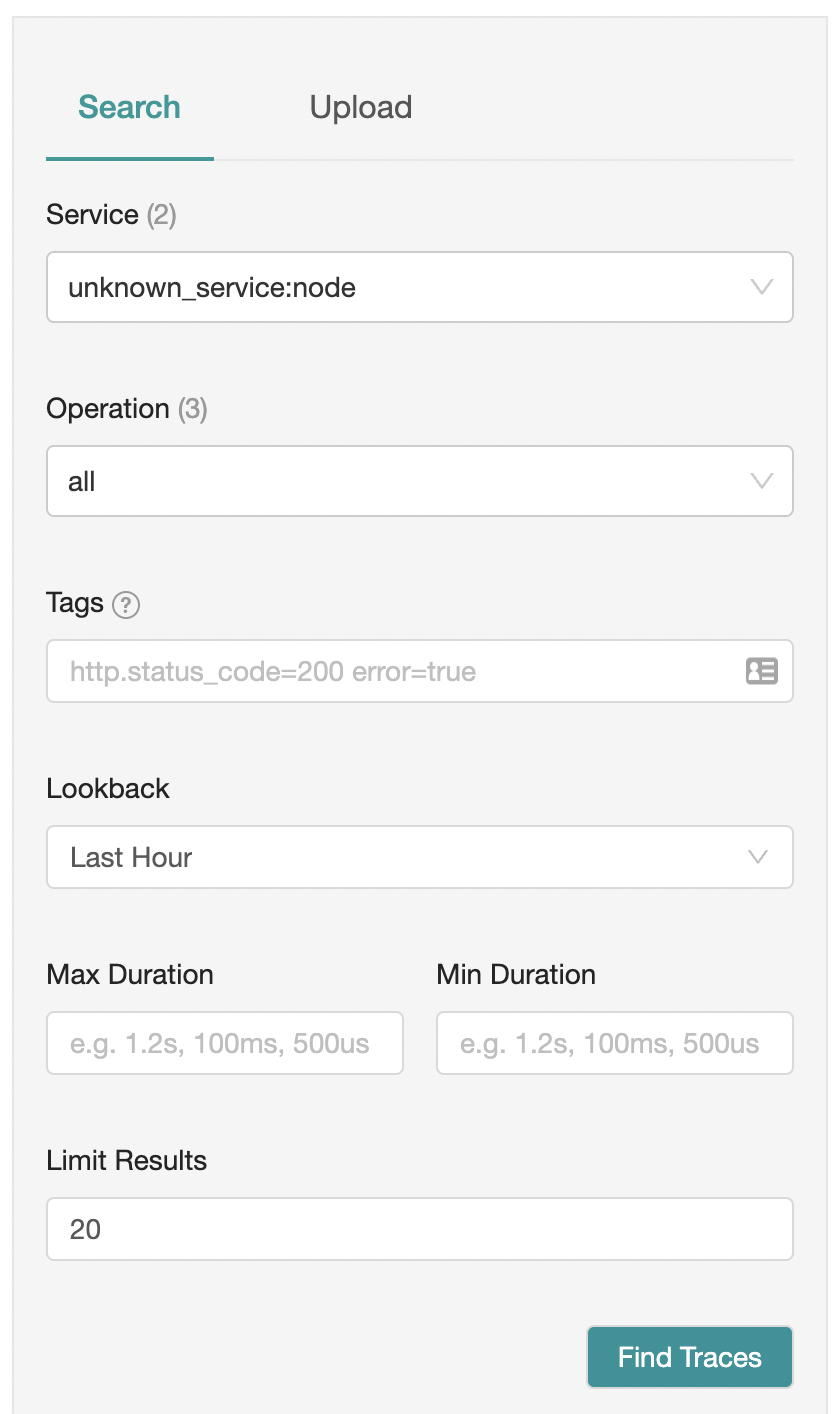
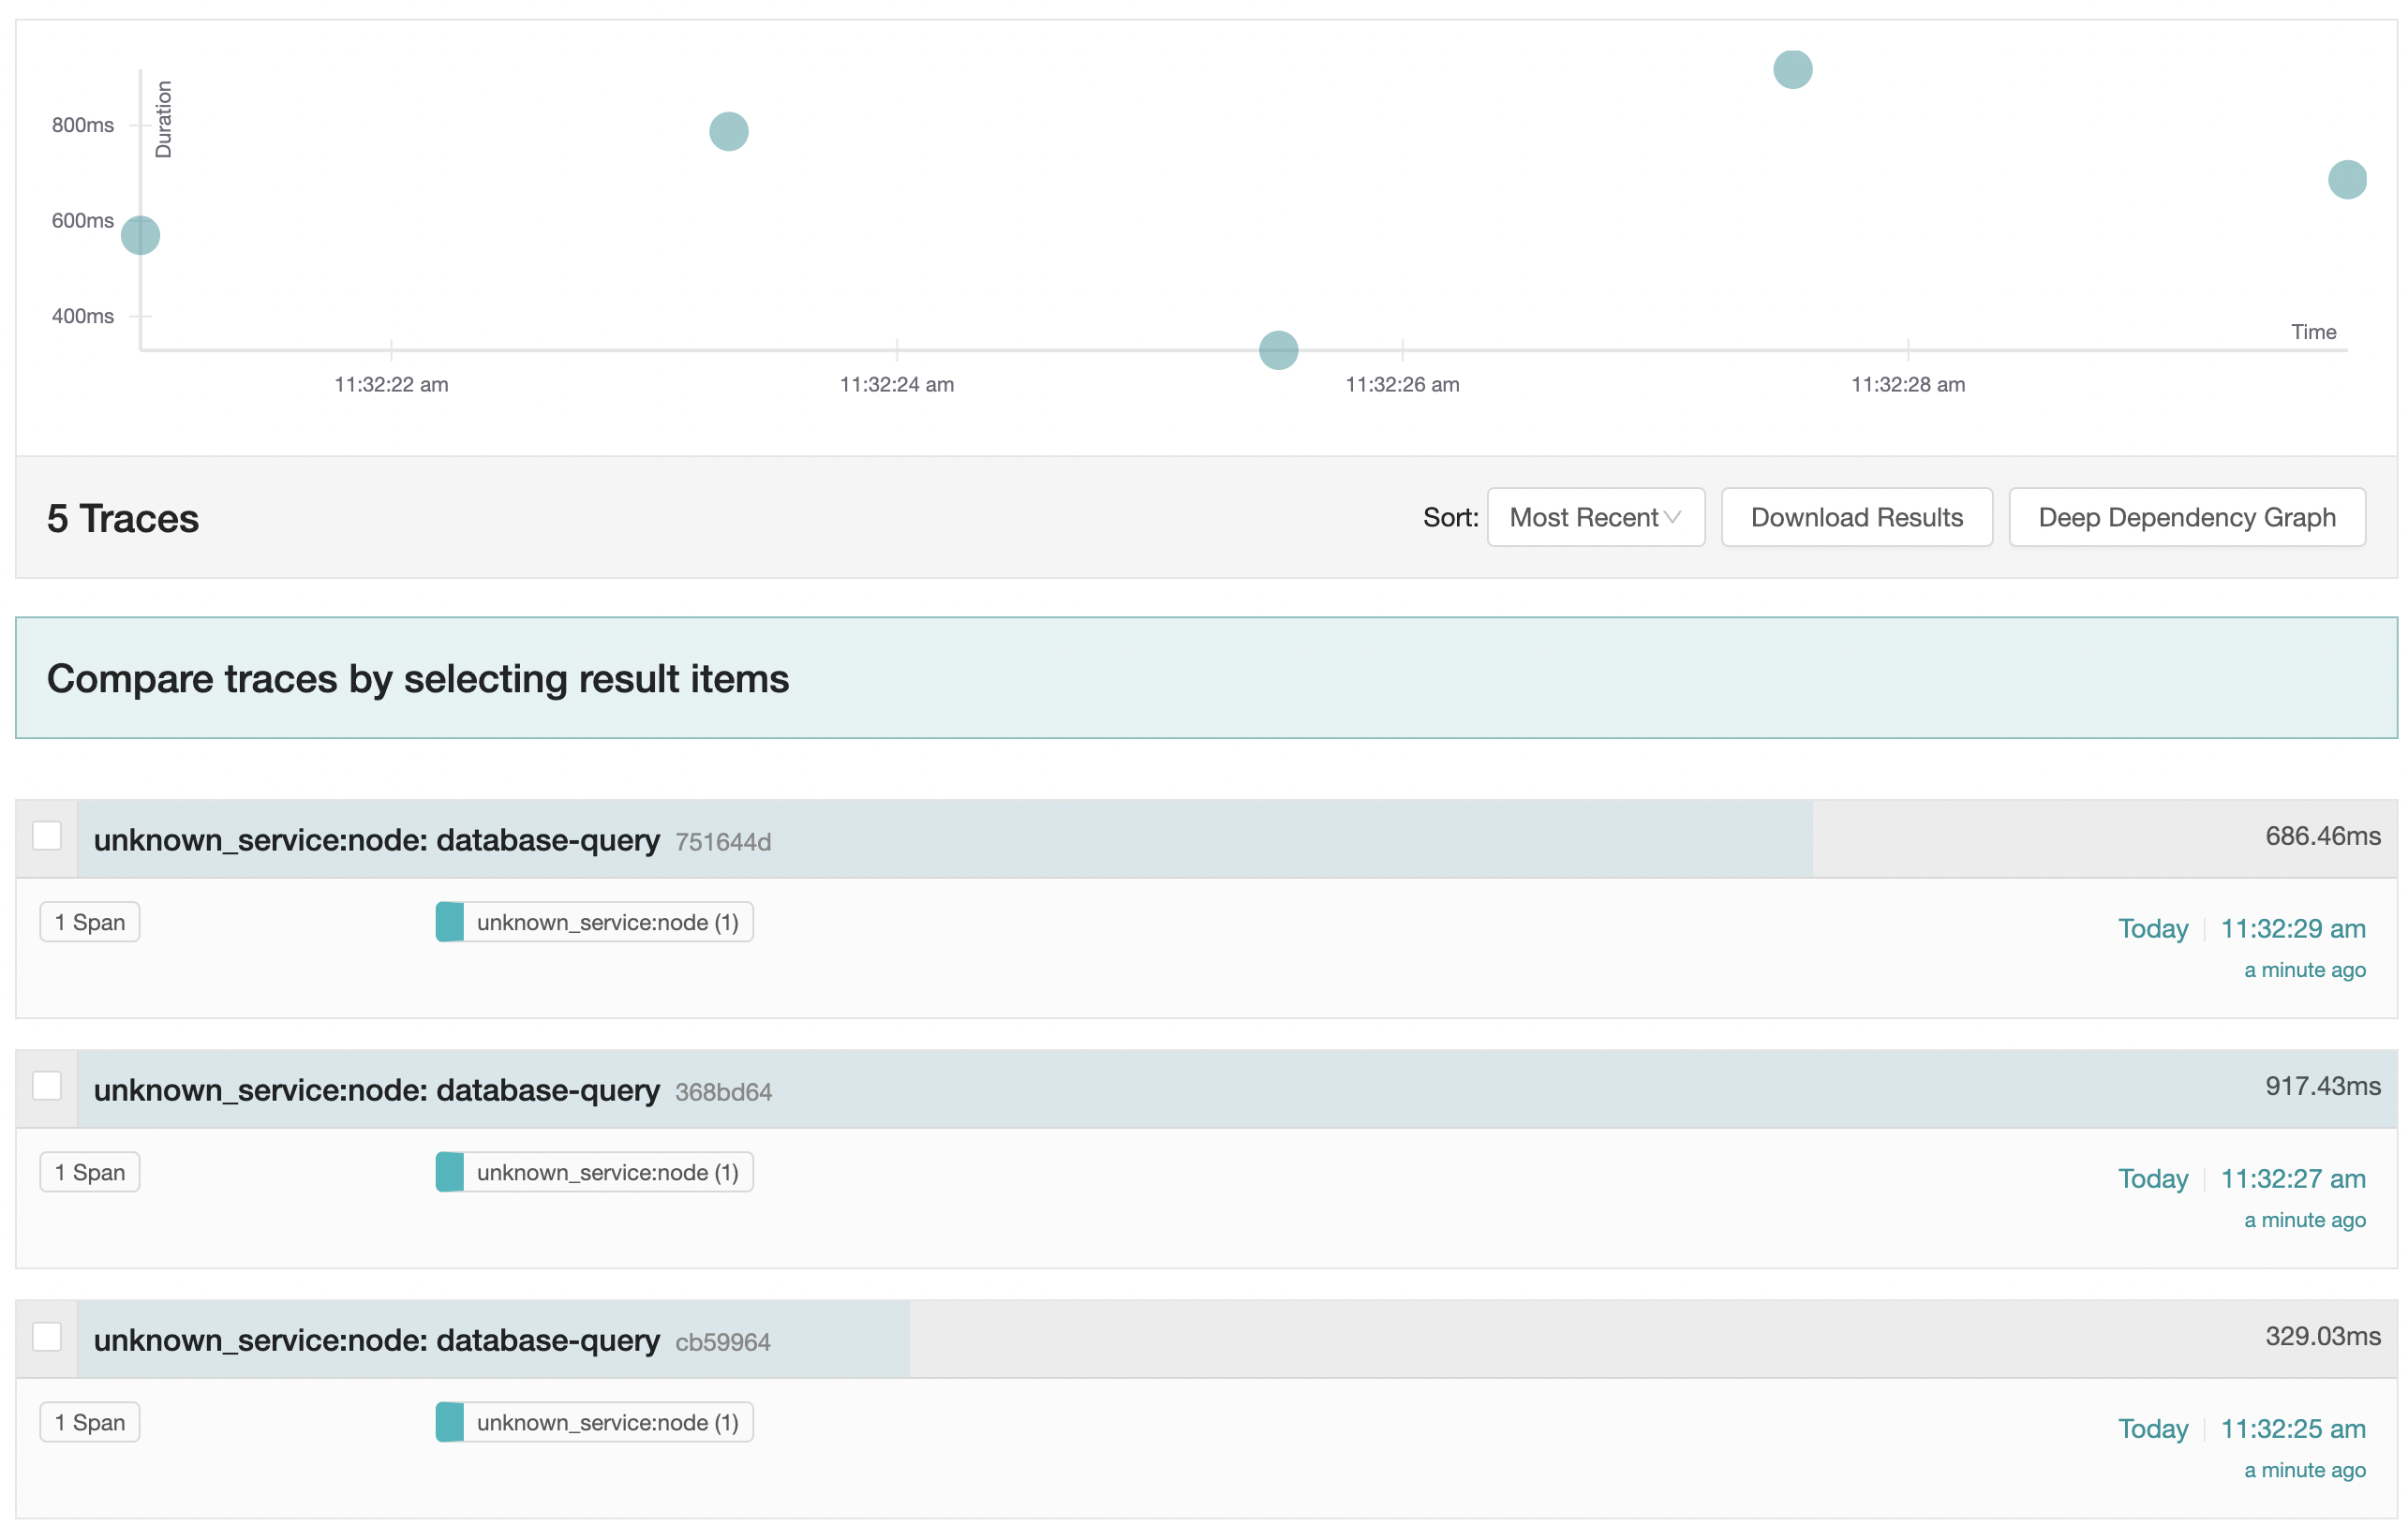
You can go a little deep down and understand the traces.
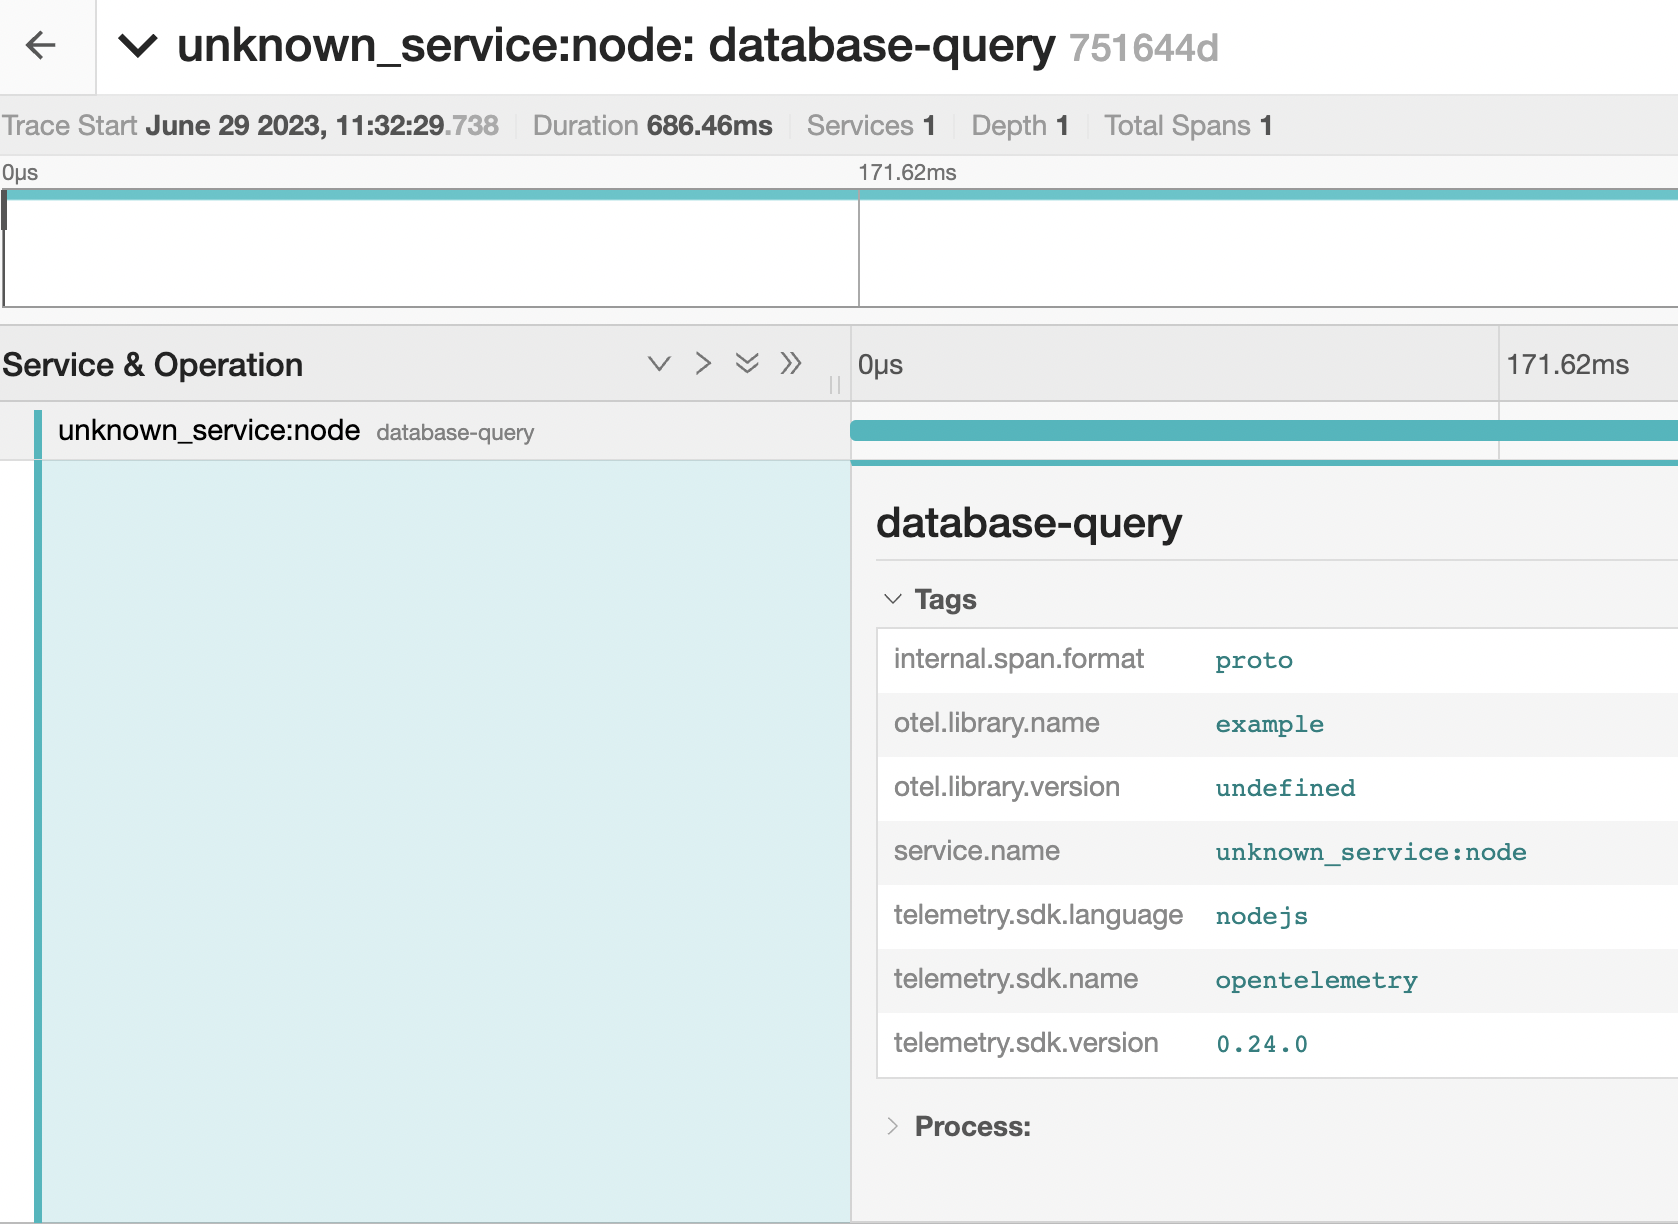
You can play with the Jaeger UI by changing the service and operation tabs.
Tutorial provided a step-by-step guide for tracing a Node.js application using OpenTelemetry and visualizing the traces in the Jaeger UI. By integrating OpenTelemetry into your application, you gain the ability to capture and propagate distributed traces, enabling you to monitor and analyze the performance and behavior of your system. With the Jaeger exporter, you can send these traces to Jaeger, a popular open-source tracing system.
By following these steps, you can effectively trace your Node.js applications, gain valuable insights, and optimize the performance of your distributed systems.
**Check out my other articles on setting up CI/CD from scratch.**

Learn How to Setup a CI/CD Pipeline from Scratch
Pavan Belagatti ・ Mar 1 '23
#tutorial
#devops
#go
#kubernetes
Also, take a look at my video where we discussed 'Observability for Developers'.


