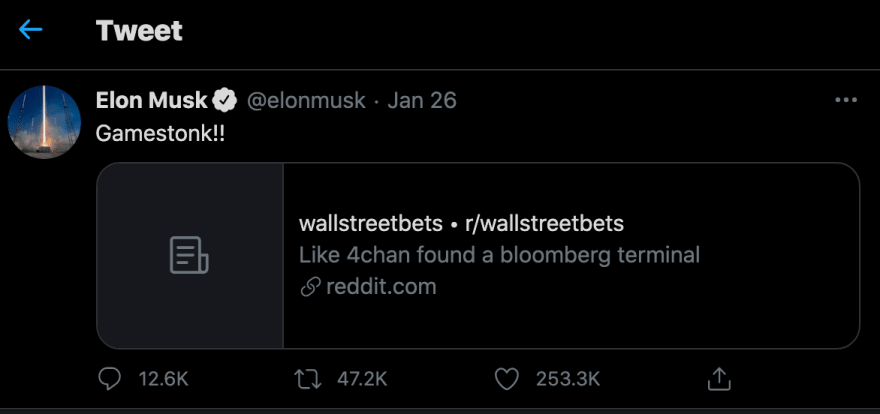
A while ago, a merry bunch on Reddit at the subreddit r/WallStreetsBets (WSB) took on Wall Street. Ironically, through an app called Robinhood.
As Alanis Morisette would say, "A little too ironic, don't ya think?"
You had to be in there and in the know at the right time to benefit from the situation. That's why we built a serverless API to keep track of all the hot and trending stock chats on WSB, that will notify you when the next GME is about to blow up. In this article, we're showing you step by step how we deployed, tested, and monitored it.
Short Squeezing GameStop
The idea behind that action was to "short squeeze" the stock. The GameStop stock was expected to fall so that people would short-sell it. Short selling in a nutshell: borrow a stock, sell it, wait until it falls, and then repurchase it and give it back to the person you borrowed it from. The squeezing part now is where WSB came in. They bought the GameStop stock in masses, inflating the price. Now, the people who short-sold would have to buy it back at a much higher price and, in turn, lose money, or at least not make a profit.
In short, lend some stock, sell it for $10 because you hope to repurchase it for $8, but in the end, it rises to $15, and you have a problem.
These things happen all the time because the market moves seemingly at random, but if hundreds or even thousands of people band together and buy falling stocks as WSB did, even seasoned stockbrokers can get into trouble.
Now, making money on the stock market isn't easy. You need to stay up-to-date to know what to buy and what to sell. Wouldn't it be nice if you could simply query an API to find out what the mass of stock traders on Reddit are up to?
Enter the Hot Stock Tracker
The Hot Stock Tracker (HST), is an API that keeps track of trending stocks on Reddit and checks if Elon Musk tweeted about them. If you call its endpoint, it will deliver JSON with the latest stock market news on Reddit.
The HST is located at https://api.hot-stock-checker.com/great-deals and can be called with a GET method. It will then return an array of JSON objects that contain the latest stock you should care about.
An example response can be seen here:
Find the original code snippets here
Installing the Hot Stock Tracker
If you want to use the HTS, you can* install it locally or even on your AWS account*. It's an application based on serverless technology, deployed with Commandeer, an IDE for the cloud.
Prerequisites
You need an AWS account to deploy to it and monitor the application with Dashbird later. The application is built with the Serverless framework, which requires Docker and Node.js.
Setup
First, you need to clone the Commandeer example repository.
$ git clone git@github.com:commandeer/open.git commandeer
You can find the HST inside the commandeer/sample-apps/robinhood-for-reddit directory. Inside this directory, you have to install all dependencies with NPM.
$ npm i
Next, you need to download and install the Commandeer desktop app.
After the installation, you have to add your AWS account. For this, you need to click the big plus button at the top left, as you can see below.
Add new account
To add an AWS account, you first need to create a new IAM user in the AWS Console. This user needs programmatic access and admin permissions because Commandeer will use it to manage all your resources.
Adding an AWS account
Now that Commandeer is connected with your AWS account, you can deploy the HST. It is implemented with the Serverless framework, so you need to scroll down in the list of deployment services on the right and select the Serverless/Runner, as shown below.
Commandeer service list
If you click on "choose file," you can now select the serverless.yml inside the cloned repository; you find it inside the sample-apps/robinhood-for-reddit directory.
If the file is loaded and set up your AWS credentials correctly, you can now deploy the stack with a click on "Run", as seen here:
Serverless runner
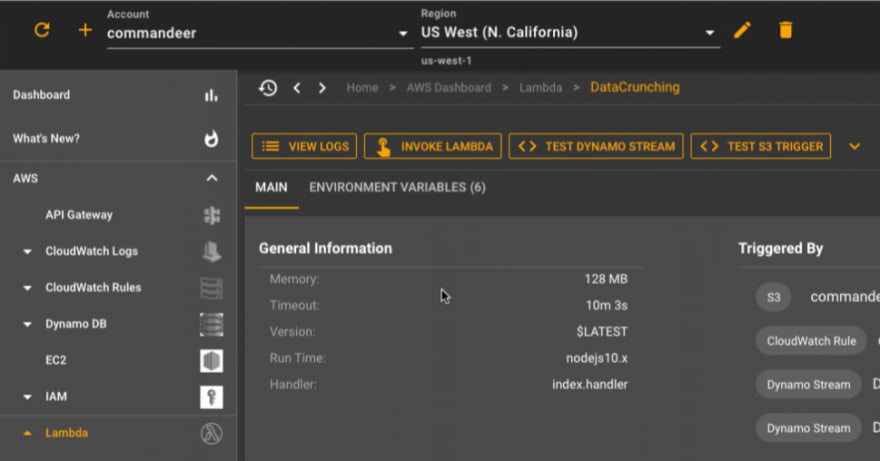
You will now have an endpoint talking to a Lambda with logs being written to CloudWatch Logs. In the below figure, you can see the endpoint in the side navigation.
Commandeer Navigation
To visualize the connection, you can see the endpoint connected to the Lambda and CloudWatch log in Figure 6. Once we set up CloudWatch Alarms on this endpoint. You will also see those on the System Diagram page.
Commandeer System Diagram
Testing the API
There are a couple of ways to test this API endpoint.
Testing with Unit tests
If we wanted to use this API in production, we would implement unit tests for it. This way, the test can be run inside a CI/CD pipeline every time we deploy a new release.
Testing with Commandeer
We can call AWS resources directly with Commandeer. This way, we can deploy, test, and debug parts of our application all in one place.
Commandeer offers two ways to test our deployment. The first is Lambda Invoke, which will, as the name implies, just invoke our Lambda function stand-alone.
Commandeer Invoke Lambda
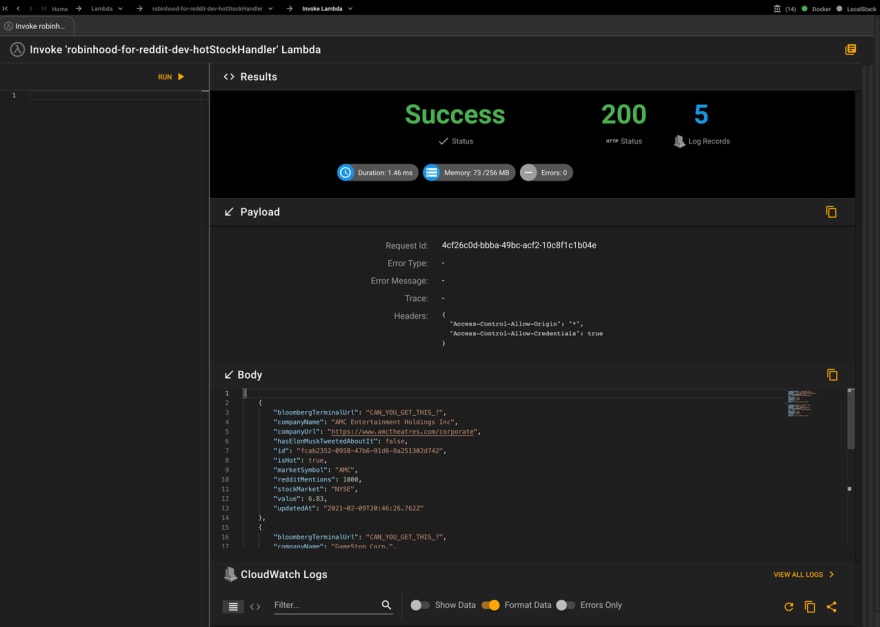
Below, you can see running the Lambda Invoke. Commandeer displays the payload and the body of the response, along with the status codes. If you scroll down further, you will see the CloudWatch Logs.
Invoke Lambda results
Invoke Lambda CloudWatch Logs
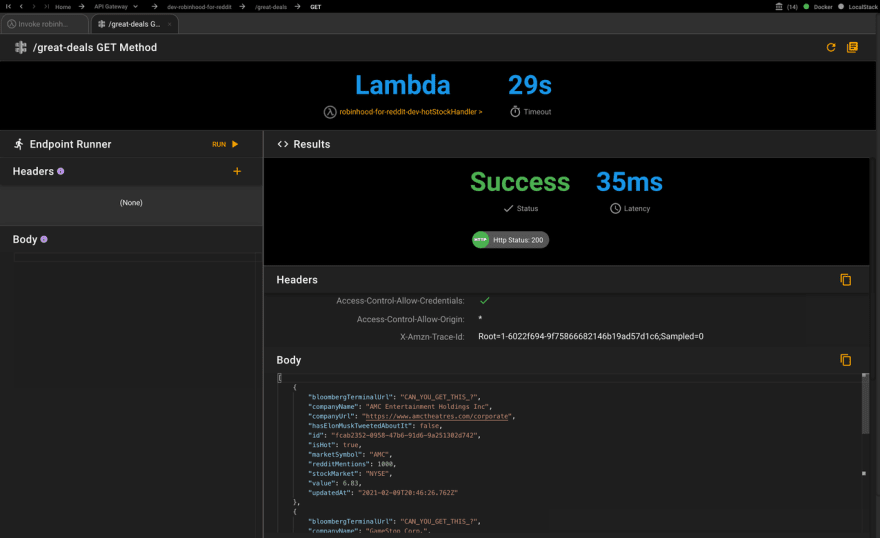
The second way is to test your Lambda function together with the connected API Gateway by calling API Gateway Invoke on the GET /great-deals endpoint. This is called an integration test, which makes sure these two services work well together. The added advantage of this is that you can make the actual call you would use from a website or app.
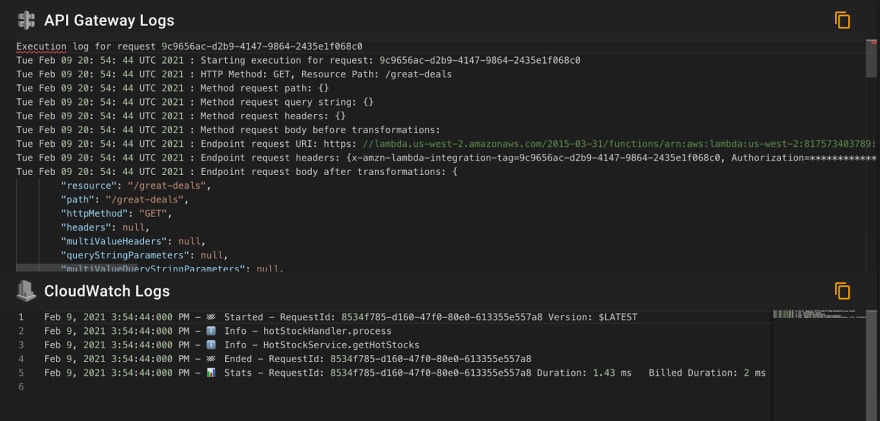
Below, you can see the results of such a test: the API Gateway Logs as well as the CloudWatch Logs.
API Gateway Invoke results
API Gateway Invoke Logs
If you want to make sure that the API works independently from all the Commandeer things we've done, you can also use a third-party API client like Postman to test the endpoint. In the below figure, you see how such a test could look like.
Postman results
Monitoring
Now that you deployed your API and checked that it worked with a testing method of your choice, you want to make sure that things stay working, and if not, you want to be notified that things have gone bad.
Dashbird serverless monitoring is the perfect way to stay on top of things. Simply sign up, deploy the Dashbird CloudFormation stack, and you're ready to go. No additional changes to your Lambda functions or API Gateways are needed.
In the below figure, you see what Lambda function insights Dashbird gives you out of the box.
Dashbird Lambda function monitoring
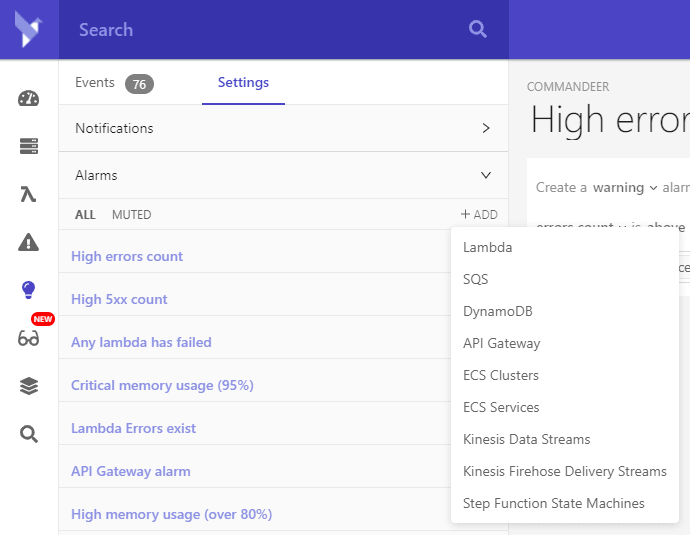
With just a few clicks, you can add alerts for these monitoring data, so you get notified immediately when things go wrong.
Dashbird Alerts
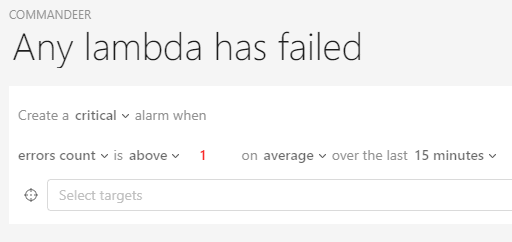
Below are some example alerts defined specifically for Lambda and API Gateway:
Dashbird alert for Lambda
Dashbird alert for API Gateway
Wrapping up
Commandeer and Dashbird are the perfect team for* serverless development*.
With Commandeer, you can deploy and test all your serverless cloud infrastructure with an awesome UI. Everything will be in one place to give you a great overview of your resources.\
Dashbird covers you for all your serverless monitoring needs, be it API Gateway, Lambda, or ECS. Everything can be found and looked into from one place, and with Dashbird alerts, you can tell Dashbird to let you know immediately when things are about to break down.

