Introduction
Today, organizations are transitioning from monolithic architecture to microservice architecture. When we speak of microservice architecture, there is no way to ignore Kubernetes (K8’s). K8’s is the leading open-source Container Orchestration Platform, and it holds a prominent position for certain reasons, such as: Robust, Scalability, High Availability, Portability, Multi-Cloud Support, Self-Healing, Auto-Scaling, Declarative Configuration, Rollbacks, Service Discovery, Load Balancing, among other features.
We all know Kubernetes is a powerful tool, but the question here is, how do I get the most out of it? The answer is simple: by proactively monitoring your Kubernetes cluster.
Challenges in Monitoring Kubernetes Clusters
Monitoring K8’s clusters can be a complicated task. Here are few difficulties faced by SRE’s.
Complexity: Kubernetes operates in a multi-layer environment, requiring the collection and correlation of metrics from pods, nodes, containers, and applications to obtain an overall performance metric of the cluster.
Security: Monitoring tools collect sensitive data from the Kubernetes cluster, raising security concerns that need to be addressed to protect the cluster data.
Data Flow: As the Kubernetes cluster grows, whether it's on the cloud or on-premises, tracing the data flow between endpoints becomes increasingly difficult.
Ephemerality: Kubernetes scales up and down based on demand. Pods created during scale-up disappear when no longer required. To avoid data loss, monitoring tools must collect metrics from various resources such as deployments, daemon sets, and jobs.
Benefits of Monitoring Kubernetes Clusters
Despite the challenges, monitoring K8’s environment can lead to significant benefits and improvements:
Enhanced Visibility: Monitoring Kubernetes clusters helps you gain enhanced visibility about overall health of your system and its components.
Proactive Issue Detection: Monitoring Kubernetes clusters enables you to proactively detect issues such as application failures, abnormal behaviours, and performance degradation. With the help of this you can prevent potential downtime and service disruptions.
Resource Utilization: By tracking the resource usage of your containers, pods, and nodes, you can fine-tune resource allocation, enhance efficiency, reduce costs, and maximize the utilization of the infrastructure.
Performance Optimization: Monitoring Kubernetes enables you to identify the slowness in the response times, inefficient resource usage and helps you to optimize scaling specific to components and optimize network settings to improve overall system performance.
Root Cause Analysis: Monitoring Kubernetes facilitates you to pinpoint the root cause, isolate problematic pods, or nodes, and analyse relevant logs and metrics.
Here comes the next question, how do I monitor my Kubernetes cluster? Monitoring Kubernetes is challenging task, but this is where monitoring tools like SnappyFlow come in handy.
Simplify Kubernetes Monitoring with SnappyFlow
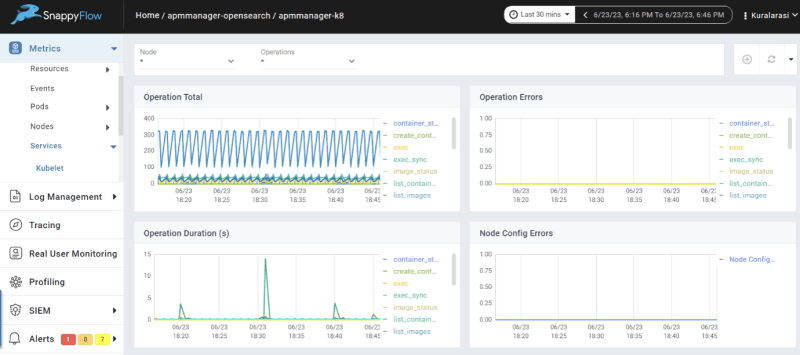
SnappyFlow is a full stack application monitoring tool. By integrating your Kubernetes cluster with Snappyflow, it starts collecting the data from your cluster and enables efficient cluster monitoring. SnappyFlow monitors various aspects of the cluster which will help you to take an informed decision. Its alerting system notifies any deviation that happens in the cluster through your preferred communication channel.
What can you monitor with SnappyFlow?
Resource Utilization: SnappyFlow monitors CPU, memory, and disk usage of nodes, pods, and containers to identify resource bottlenecks. This helps to ensure efficient utilization of the resources and prevents overloading.
Pod Health: SnappyFlow tracks the status and health of individual pods, including their readiness and liveness probes. It monitors the pod failures, crashes, and restarts.
Cluster Capacity: SnappyFlow keeps an eye on cluster capacity to avoid resource exhaustion. It monitors the number of nodes, available resources, Daemon set, Deployment, Replica set, stateful set and the ability to schedule new pods. It also monitors how many critical and warning events are occurring in the cluster.
Network Performance: SnappyFlow monitors network traffic, latency, and throughput at node level.
Persistent Volumes: SnappyFlow monitors the status and capacity of persistent volumes (PVs) and their associated claims (PVCs). Ensure that storage resources are available and accessible as required. It also monitors Read and Write operations.
Service Discovery and Load Balancing: SnappyFlow monitors the health and availability of Kubernetes services and their endpoints. Track load balancing across pods to ensure even distribution of traffic.
Kubernetes API Server: SnappyFlow keeps an eye on the API server's performance, latency, and response times. Monitors for any errors, throttling, or potential bottlenecks in API communication.
Logging and Event Monitoring: SnappyFlow sets up centralized logging and monitoring to capture container logs, Kubernetes events, and system-level metrics. check for issues related to image pulling, container startup, or resource allocation. This enables quick troubleshooting and identification of issues.
Conclusion
In summary, SnappyFlow offers a simplified and effective solution for monitoring Kubernetes clusters. By leveraging SnappyFlow, you can ensure the health and performance of your Kubernetes cluster while reducing the complexity and effort involved in monitoring.


