Your AWS Lambda code is throwing errors in production. To defuse the situation, you need to pinpoint what’s going wrong and find the fix. It’s a good thing you already instrumented your Lambda with high quality, well structured logs, right?
There are many aspects to monitoring a distributed system. And a big part is understanding how, and what to log. But, fear not, you’re in the right place!
Today we’re going to talk about the first step: how you can get Lambda logs into CloudWatch for analysis. Once we’ve discussed that, in the next article, we’ll discuss how to analyse those logs to properly extract the data.
By the end of this article you’ll understand the three steps you’ll need to take to enable CloudWatch logging for a Lambda function.
Before we dive in with the CloudWatch specific stuff about logging, let’s get on the same page with regards to what logging is in a software context.
Logging is the practice of emitting and storing persistent entries about how an application is running, for future analysis.
Sounds great and all, but why would we want to log in the first place?
Why do we need logs for AWS Lambda?
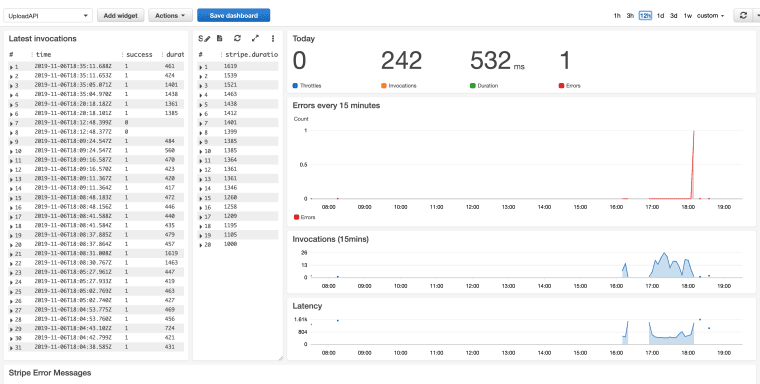
Lambda, by default gives us various metrics out of the box that we can use for monitoring. Such as: Length of invocation time, error rate, etc.
Whilst these metrics are really useful on a high level, they don’t give us the lower level detail we need, specific to our application.
- Did our third-party integration fail?
- Is there no access to the database?
- What did the user input in order for the request to fail?
These are valid questions you may want to ask of your running Lambda. And these questions can only be answered if you’ve got high quality, well written log entries.
And the first step to getting going with logs in Lambda, is to start seeing them in CloudWatch. So let’s go ahead and get that setup…
How does AWS Lambda Logging Work?
AWS Lambda is closely integrated with AWS CloudWatch. CloudWatch has many different features, such as dashboards, queries and metrics. But for today we are interested mainly in the logging side of things.
To get CloudWatch working with Lambda, we need three things…
- A CloudWatch Group
- Correctly setup Lambda permissions
- At least one log line entry
So let’s break each one of these down…
Step 1: A CloudWatch Group
CloudWatch Log Groups
In CloudWatch, your logs are put together in groups. Groups simply allow you to distinguish between logs made by different components. You have two choices for creating your group: You can either make the log group yourself, by adding it manually. Or, you can allow your lambda permission to create the log group itself (but we’ll discuss Lambda permissions in a moment.
At this point, you might be wondering why bother creating a log group manually if Lambda is creating it for you? And the answer is usually to reduce magic in AWS. If you’re using infrastructure as code, then you’ll likely want to have that group in code, so that it can be better managed, audited, etc.
(If you’re interested in knowing more about infrastructure as code, I’d suggest you check out: Infrastructure As Code: An Ultimate Guide)
Important: Whether you’re creating your log group manually or not, you need to remember to name your log group using the following convention:
/aws/lambda/<your function name>
Otherwise your Lambda logging simply won’t work. But, creating a log group alone won’t get our logs working…
Step 2: Give your AWS Lambda permission
Lambda Log Permissions
The next step once you’ve got your log group is to give your Lambda permission to log to it.
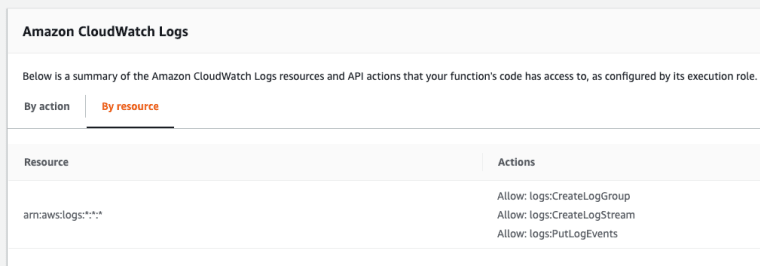
If you created your log group manually, you’ll only need to give the Lambda two permissions: logs:createLogStream and the logs:PutLogEvents permission. If you didn’t create the log group manually, you’ll also need to add the logs:CreateLogGroup permission. You can also see these permissions in the screenshot above.
Awesome, you’re nearly there, just one more thing…
AWS Lambda Designer
Step 3: Log to CloudWatch from Lambda
Monitor Lambda Logs
And last up, now that your Lambda has access to log to CloudWatch you’ll get some generic log data from AWS, but you’ll need to start adding your own entries if you want to see them. Your log entry will vary per language, but will look something like…
console.log('hello world!')
And you should now start to see log entries with each Lambda invocation.
AWS Lamda Log Output
But, what are Log Streams?
Lambda Log Streams
At this point, you might have noticed we mentioned log streams in our permissions, and you might be wondering what they are? It’s important that we note log streams when talking about logs as they really baffled me at the start.
Without going into too much detail, a single lambda can run on many bits of underlying infrastructure. When exactly the underlying infrastructure is created depends on many factors, like how often your lambda is getting called.
The important bit to note is that when AWS spins up some new infrastructure under the hood, they create a new log stream. That means when you look at your logs, different invocation calls may be scattered across many log streams.
At this point you are probably thinking: Okay, so now I know how to emit log entries, but that doesn’t help me to know what I need to log, when and in how much detail? What are the gotcha’s?
How to know what to log and when?
If you’re running a large scale system, randomly throwing log entries into your logs ad-hoc isn’t going to yield results, you’ll get totally swamped in data and it’ll be hard to make sense of anything. So if you had a hunch that might be the case, you were right.
In order to really get the value out of our logs, we need to structure them, and learn how to query and analyse them. But, since it’s a really big topic, we’ll leave that for next time. For now, get your logs up and running and experiment emitting data, and getting used to bouncing between Lambda and CloudWatch.
In the next part(s) we’ll discuss why structured logging is far superior for logging, why you should be logging fat log events, not multiple lines and how to query log events with CloudWatch insights, setup dashboards etc.
Speak soon Cloud Native friend!
The post How To Get AWS Lambda Logs Into CloudWatch appeared first on The Dev Coach.
Lou is the editor of The Cloud Native Software Engineering Newsletter a Newsletter dedicated to making Cloud Software Engineering easier, every 2 weeks you get news and articles that cover the fundamental topics of Cloud Native in your inbox.


