Recently I find myself in the position of applying monitoring to existing software applications quite often. Whilst I have been applying the monitoring tools, I noticed that I follow the same steps each time…
Which got me thinking: “Could you create a ‘recipe’ or ‘cookbook’ for how to apply monitoring to an existing software application?”. I set to work writing this article, and I can conclude, the answer is: yes!
By the end of this article you’ll know the 5 steps you should take when setting up monitoring on an existing service.
A lot of online artices for monitoring gives broad and general advice: add logs and traces, the articles are aimed at new “greenfield” projects, or it’s technology specific i.e Splunk, DataDog or New Relic.
The impractical nature of these articles can be frustrating. Often the true reality is that we’re somewhat stuck with the monitoring tools we’re provided by our company, and typically we work on existing applications.
We need strategies for monitoring our applications using the tools we have. Today we’re going to look at exactly this. What are the high value, tool-agnostic things you should do when setting up monitoring on an existing service?
And with the introduction covered, let’s get to it…
The Monitoring Mindset
Observability = % of questions your tooling answers without re-instrumenting.07:04 AM - 15 Jun 2020
Simply put: good monitoring answers questions.
As we go through the different steps today, you should spot a common trend.
And the trend is: monitoring is fundamentally about asking questions and using our tooling to answer them. When you master the art of monitoring, you should be able to answer any question without needing to re-instrument.
Sound impossible? It’s not.
Todays Use Case: AWS Lambda
In order to explain the topic we’ll need a real use-case. For today, our example service for monitoring will be a Lambda Web API. But don’t worry—the principles and ideas presented will work no matter your service type or tool.
Let’s imagine this Lambda function has been handed over to you, and you have the task of understanding the service, setting up monitoring and improving it.
Whilst using Lambda and AWS we can utilise CloudWatch. CloudWatch gives us everything we need for today, dashboards, log querying and visualisation and alarm setup. This isn’t an advert for CloudWatch, it just has the tools we need.
You don’t need any Lambda / Serverless knowledge for this article, but if you’re curious, be sure to check out: Serverless: An Ultimate Guide
1. Dashboard Your High Level Metrics
In our first steps, we want to get an understanding for the basic usage of the service: “What load does the service handle?”, “What time of day are requests received?”, “How many errors is the service throwing?”.
So the first step I would would be to set up a dashboard.
AWS Dashboard
Dashboards give us a birds eye-view of the different aspects of our service brought together into a single view. Having a single view is useful as we can also correlate between values and begin to ask questions…
- “Do errors correlate with requests?”
- “Do errors correlate with timeouts?”
But, what should you be adding to your dashboard? I like to start with some basic time-series line charts. These give us a good understanding of the general usage of the service. Some good first charts to create are:
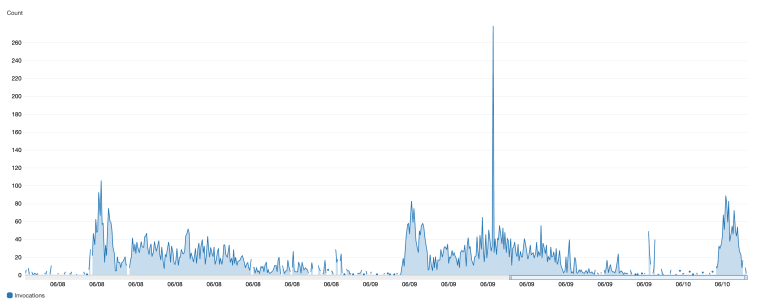
- Invocations / request count
- Error frequency (in our case 5XX responses)
- Latency (response time)
When placing these line charts, I like to stack them on top of each other, as that allows you to correlate between them. These charts should immediately start to raise some more questions…
- “Are our requests timing out or error-ing?”
- “Why do we receive errors at that time of day?”
- “What is common about the requests that fail?”
CloudWatch Metrics Dashboard
To create our dashboard we can use CloudWatch, and existing Lambda metrics. If you’re using a server application stack, you may need to access logs from an API gateway or load balancer in order to create these charts.
2. Log Common Failures
Now that we’ve got an overall picture of our service and it’s behaviour, new questions will emerge about why certain errors are occurring for us. We’ll want to collect more data to understand answer these questions about our service.
To get the data, we’ll need to use logs entries.
Application Logs
Logs are arbitrary data emitted an application as it executes that give us more detailed information about our system and its behaviours.
In our example our logs are shipped from our Lambda into CloudWatch, and we can use CloudWatch Logs Insights to parse and query our log data.
Unlike higher level metrics that we already have on our dashboard, logs are often unique to a given application. That being said, there are still some common places that we’ll want to add log entries within our application. Let’s take a look at what those common places to add log entries are…
- Input / Output — High value data to emit in logs are the arguments passed into the service, e.g. request headers, request body.
- Service Integrations — Networks are notoriously flakey, any time you call another API or service, consider logging the integrations request data and response data.
- Errors — Anywhere there’s a chance for an error, such as input validation, consider emitting a log value.
Sometimes tools will emit logs for us, but a lot of the time we’ll have to put in the manual work of adding log entries ourselves (in quite a manual way).
With these high value logs added, we can then add start to add them to our dashboard and queries for interrogation. We can now ask:
- “Are our errors correlated with a certain type of user input?”
- “Which specific errors happen most frequently?”
Grouped Query Results
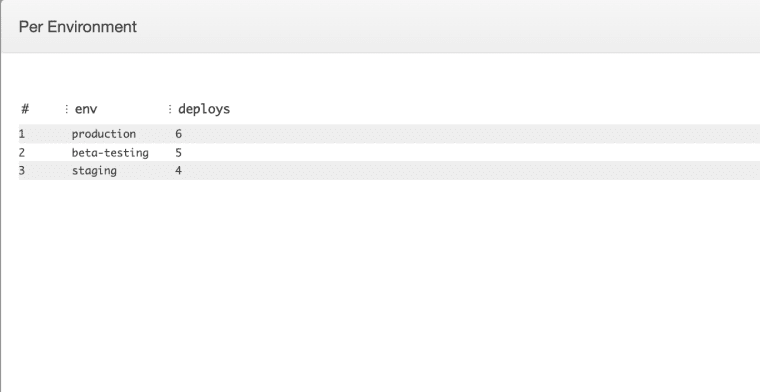
For these types of logs, I like to create data tables which show the sums of each group. Then, when you find a large cluster of errors, you can select just that time period and start to notice if any of your groupings are prevalent.
At this point you might be wondering: “But apart from those generic areas, how do you ensure that you’re catching all possible scenarios to log in?”. It’s a good question, but not one without an answer, let’s cover it now…
There are many philosophies for logging formats. If you’re interested in my preferred philosophy (which allows you to interrogate your data very easily) check out: You’re Logging Wrong: What One-Per-Service (Phat Event) Logs Are and Why You Need Them.
3. Log Unknown Errors
A process that helps you understand and get a handle on errors within a service is to track the known vs the unknown errors.
An unknown error is an error which occurs that you didn’t expect, or handle explicitly. To ensure that all errors are handled explicitly, I have a process whereby I track all unknown errors within the service.
To do this, I wrap the entire service in an error handle, or try/catch, logging each time an unknown error is found. Over time, I then track and slowly replace the amount of “unknown” errors with explicitly thrown errors.
Example try/catch error log
One way that you can catch unknown errors elegantly is by the use of error codes. Error codes point to each unique occurrence of an error. Every error in your system should have it’s own unique error code, which then allows you to trace exactly where in the code that particular error was thrown.
Filter out unknown errors
Once you’ve instrumented your application with these unknown error logs, you can then start to add them to your dashboard and visualise them. You can start to see which errors occur more frequently, and when, and also track the overall rate of unknown system errors.
4. Create A Runbook
Runbook
Another useful tool when debugging a new service, is to create a runbook.
As I going, digging through logs and data, there are some useful queries that I might not necessarily want to add to our dashboard. For these queries I add them to a runbook file, which I store alongside the repo for later use.
In addition to queries, you can add links to your dashboards, components and metrics, for easy access later. It’s a good practice to record your findings and your collected queries for other engineers or your future self.
By this point you should be well on your journey to understanding your service, and how it runs, and tracing and reducing any errors that are occurring. But there is one last step I would take before calling this initial phase of monitoring complete…
5. Setup An Alarm
The last thing you’ll want to setup if you haven’t already is an alarm.
Alarms warn you of a situation that has occurred within your service. In AWS, we can use CloudWatch Alarms. The logic for your alarm would look something like this: “If more than X errors in X time period, send notification”.
Alarm CloudWatch
Alarms come in different forms, alarms can email you, or send you a text messages. There are some advanced tools out there that exist, like PagerDuty which allow you to do fancy things like track the alarms, write notes on them etc.
But we don’t want to get too caught up with fancy tools when we’re initially understanding a service, simply having some alerting in place is a good start. You can start with a crude, yet simple alarm, and then progress to more advanced alarms over time.
The first alarm you’ll want to setup is on failure. Decide the level of tolerable failures within your system, and set your alarm to alert if more or less failures occur than you’re happy with.
Monitoring: Completed It.
Hopefully this helped you start your journey with monitoring. Monitoring is a complicated topic with a lot of “it depends”. However, follow the steps we discussed today and you’ll be in a great starting point.
From here, you can experiment with more dynamic monitoring methods such request tracing with a tool like X-Ray, setting up a paging tool like PagerDuty, Anomaly Detection Alarms, and more.
Speak soon, Cloud Native friend!
Do you have a standard process for monitoring existing software? What steps do you usually take?
The post How To Setup Monitoring / Observability On Existing Software (e.g. A Web API): A Practical 5 Step Guide. appeared first on The Dev Coach.
Lou is the editor of The Cloud Native Software Engineering Newsletter a Newsletter dedicated to making Cloud Software Engineering more accessible and easy to understand. Every month you’ll get a digest of the best content for Cloud Native Software Engineers right in your inbox.


