By: Billy Vong & Scott Cooper
Adding Instrumentation to Jest
Here at Sentry, we like to dogfood our product as much as possible. Sometimes, it results in unusual applications of our product and sometimes these unusual applications pay off in a meaningful way. In this blog post, we’ll examine one such case where we use the Sentry JavaScript SDK to instrument Jest (which runs our frontend test suite) and how we addressed the issues that we found.
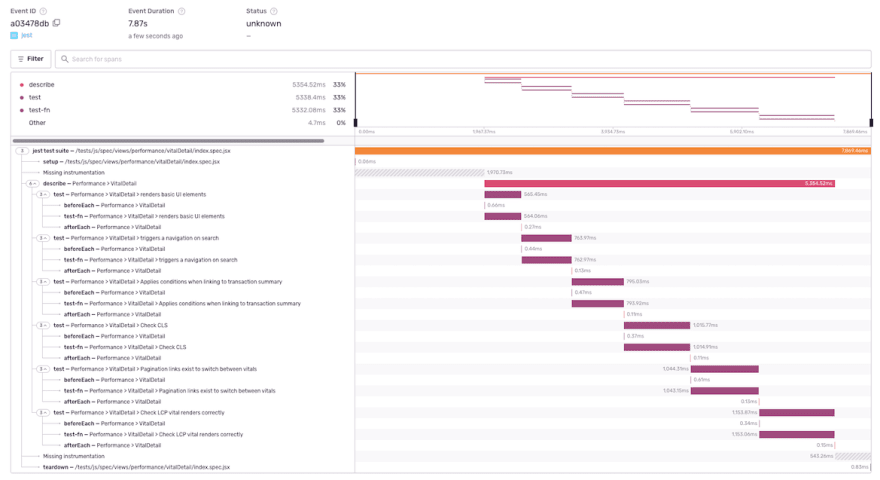
We have high-level metrics for how well (or not) our CI is performing. This is useful to get a general sense of the health of the system, however, it does not help when doing a deeper dive into why a system is slow. We decided to instrument our CI jobs at the test runner level in order to get insights into the performance of the individual tests. We needed to be able to see if our test suite was slowing down because we were adding more tests or if it was because we had poor-performing tests.
As mentioned above, we use Jest as our test runner. It’s important to note, that our instrumentation method requires using jest-circus test runner. This is the default for Jest version 27, however, it can be used with earlier versions of Jest. jest-circus is required because it allows us to listen to events from Jest by using a custom environment and defining a handleTestEvent method. Below is a basic test snippet annotated with an approximation of where jest-circus’s events are fired.
// --> setup
// --> add_hook<beforeEach>
// --> start_describe_definition
// --> add_hook<beforeAll>
// --> add_hook<beforeEach>
// --> add_hook<afterEach>
// --> add_hook<afterAll>
// --> add_test
// --> finish_describe_definition
// --> run_start
describe('describe', function () {
  // --> run_describe_start
  // --> hook_start<beforeAll>
  // --> hook_success<beforeAll>

  beforeAll(function () {});
  beforeEach(function () {});
  afterEach(function () {});
  afterAll(function () {});

  // --> test_start
  // --> hook_start<beforeEach>
  // --> hook_success<beforeEach>
  it('test', function () {
    // --> test_fn_start
    expect(true).toBe(true);
  }); // --> test_fn_success
  // --> hook_start<afterEach>
  // --> hook_success<afterEach>
  // --> test_done

  // --> hook_start<afterAll>
  // --> hook_success<afterAll>
}); // --> run_describe_finish
// --> run_finish
// --> teardown
Sentry’s Performance Monitoring instrumentation is tree-like in structure with a transaction as the root node, and spans as child nodes. We can use a combination of the event name and the test name to determine if we should either create a transaction, create a child span from an existing transaction or end a span/transaction. Here’s an example of how we implemented it.
Fixing Performance Issues
Starting an investigation into a slow Jest test is a bit like peering into a black box because there’s so much abstraction. So the first steps are - find out which tests to look at and then find out what they’re spending time doing. The slowest tests were all larger page views with many subcomponents and components that access data from our data stores. Bigger components should be slower, right?
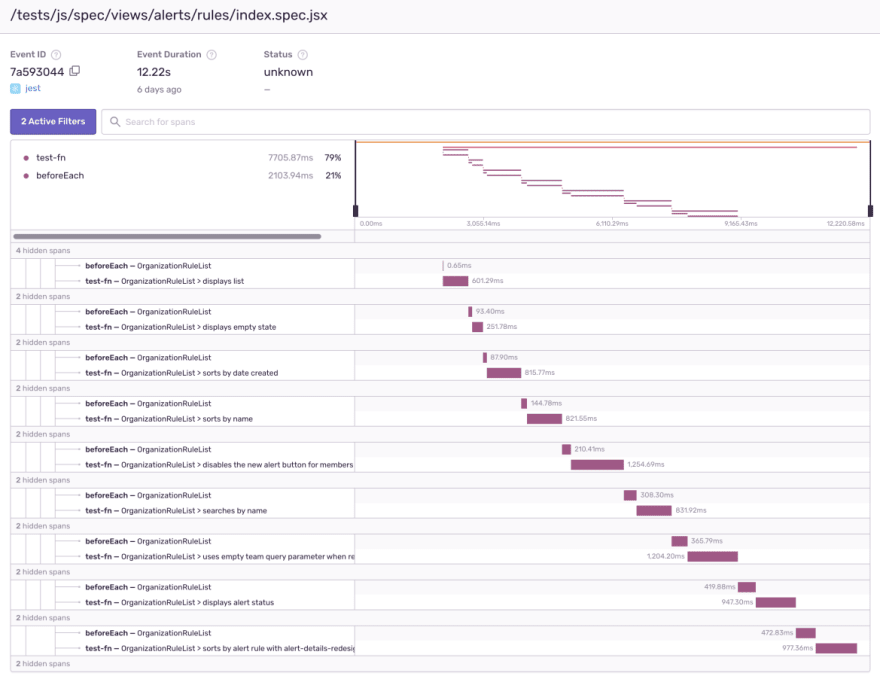
Looking at the “alert rules index” test we can see that the beforeEach function is getting slower after every test, yet the code in the beforeEach block remains the same and should take just as much time on the first test as it does on the last test. Looking at what is in the beforeEach function wasn’t enough to decide what was slowing it down. beforeEach contained a few api mocks and a call to ProjectsStore.loadInitialData([]); that was initializing the project store with an empty array. But none of that should be slow, so let’s have node tell us what is happening.
Start jest using the node debugger on just the one test file. The --inspect-brk flag tells node to wait until we have attached our profiler.
node --inspect-brk node_modules/.bin/jest --runInBand --no-cache tests/js/spec/views/alerts/rules/index.spec.jsx
After profiling the test and zooming into the area where the tests are running, we located the code that runs during the beforeEach. In this screenshot, we’ve renamed the anonymous beforeEach function to a named function badBeforeEach so it can be found easier. Below it is one call to ProjectsStore.loadInitialData followed by several calls to setState and a bunch of react work being kicked off. This shouldn’t be happening as there shouldn’t be a component listening to the store yet.
This led us to check that the component was being unmounted after each test. We added a componentWillUnmount to the class component being tested with a console.log inside to see if it was being called. When we did not see the console.log, we tested it manually by unmounting the component after every test.
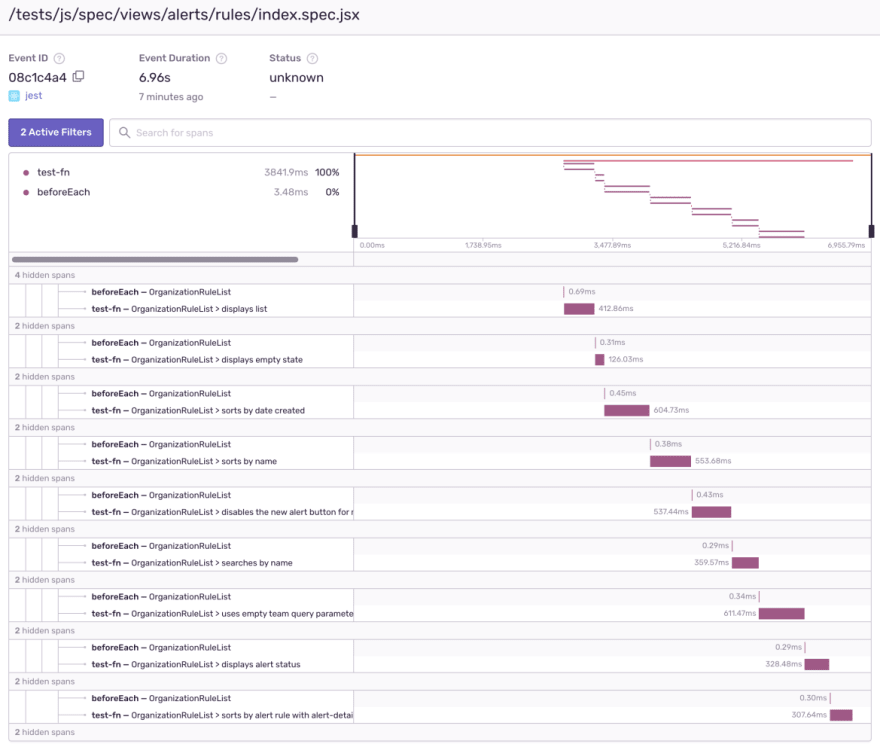
The result: our beforeEach function takes a fraction of a second every iteration instead of running change detection in components that should have been unmounted and our test has its overall total time cut nearly in half. The enzyme docs warn you that calling mount instead of shallowMount will persist components in the DOM and the reason we’re seeing a larger impact on this test is because the store is still triggering change detection in components that should’ve been destroyed.
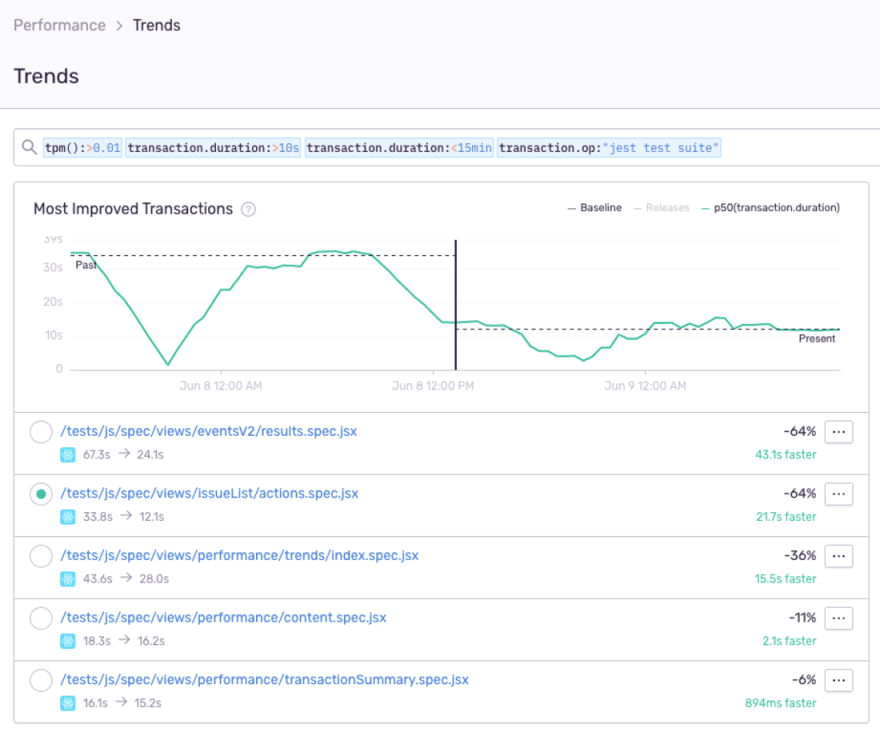
Using Sentry’s Performance Trends feature, we can confirm the performance impact these changes made to the tests.
Instrumenting your own tests
We provided an example Jest environment that you can use if you’re interested in instrumenting your own Jest tests. You’ll need to install the jest-sentry-environment package and update your Jest configuration to use the fore-mentioned package, as well as supplying your Sentry DSN. For further instructions, please see the repository.


