For those who aren’t that familiar with it, Electron is an open-source framework that allows developers to build cross-platform desktop applications in JavaScript. Some of the most popular desktop applications like VS Code, Slack, Discord, and Atom, are all built in Electron.
While Electron makes it easy to build cross-platform applications, maintaining them is a whole other thing. You need to be aware of OS-specific challenges, the machines your applications are running on, and their configurations. Version 3.0 of our Electron SDK helps you get a handle on all these unknowns with more context on every error, insight into when a release starts to degrade, and enable distributed tracing to easily see where the most time in a transaction is spent.
Get started
Install
# Using yarn
yarn add @sentry/electron

# Using npm
npm install @sentry/electron
Configure
import * as Sentry from "@sentry/electron";
Sentry.init({ dsn: "https://examplePublicKey@o0.ingest.sentry.io/0" });
You need to call init in the main process and every renderer process you spawn.
With V3.0 of Sentry for Electron, you can automatically monitor application performance without any additional configuration. As well as, track crash-free sessions by release, and unlock more information for every issue like CPU details, display data, memory status, language details, and more. Check out the release notes here.
Electron Performance Monitoring
Errors are only half the story. Electron developers also need to know if their app responds quickly to user input on any machine or operating system. This type of visibility helps you see if objects load quickly when called—and, if not, then provide you with tools to solve what’s urgent, faster.
Sentry’s performance monitoring for Electron surfaces conditions that cause bottlenecks or latency issues for Electron renderer processes, along with a breakdown of operations within each transaction. So you can easily see which span is taking the longest and save yourself the frustration of clicking into every trace and span by getting operation details and insights on a silver platter.
Electron Release Health
Version 3.0 automatically captures session data to help you better understand how each app release is performing. Sentry calculates crash-free sessions, crash-free users, and version adoption by release. If a release inexplicably tanks your crash-free users, you can see the moment a release starts to degrade and get a list of new issues and failed transactions. Plus, we also provide a list of commit authors so you can skip git blame and just Slack your teammates who are best suited to fix the problem (that they created).
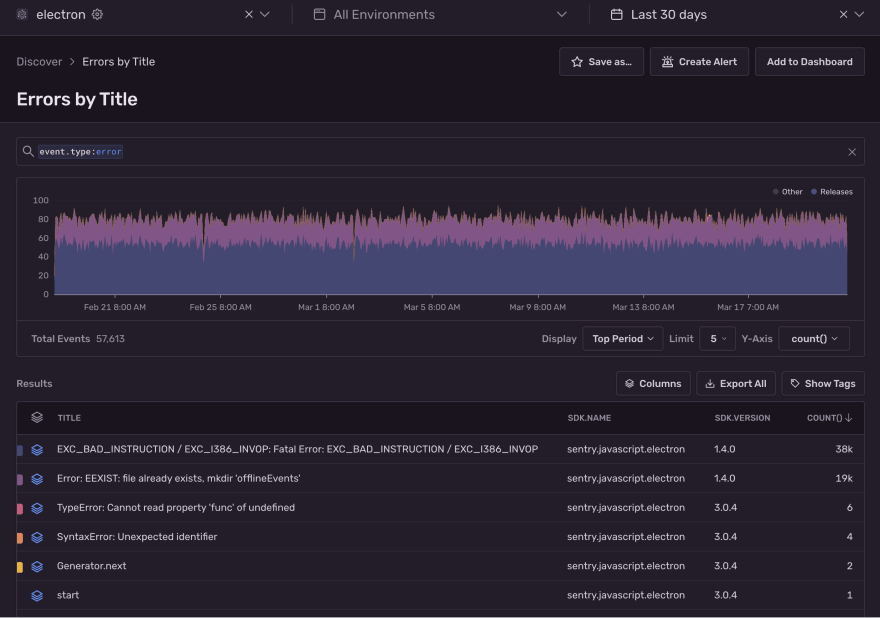
But hey, don’t know why there was a dramatic dip in crash-free sessions? This is fine. Click “Open in Discover” from any release details page; then, Sentry will automatically build and run a query for events by release to help you get to the root of any problem.
Explore whether multiple conditions contribute to an issue: does this only happen on a specific machine or operating system? Or does it affect all Linux machines? Or all Windows 11 users? Answer it quickly in Discover.
Discover also includes pre-built searches that help answer common questions about all your events, unique errors, and clients. And if you don’t like these thoughtful, hand-crafted, pre-built searches, you can modify them and save them to a custom dashboard.
Electron Error Monitoring
Understanding issues across various devices with access to different metadata, latencies, network issues, and upgrade cadences is hard and getting exponentially harder. Sentry for Electron 3.0 helps developers see what actually matters, solve issues faster with richer context, and learn continuously about their applications.
Not only will you see the user impact of each issue, but you’ll also get all the information you need to know about the machines the error happened on, like:
- CPU (processor count, machine architecture)
- Screen (density, resolution, height/width)
- Memory
- Language Details (locale details)
To wrap it up
Developers need visibility into when a user writes to disk, fetches media, loads an object in a given viewport—or, simply when a user tries to launch the app. Without this data, untreated performance problems and serious errors inevitably result in a poor user experience.
Update your Electron SDK to immediately know everything about the hardware, OS, screen orientation, network conditions, and device language settings for every issue caught and reported by Sentry. Solve issues with context and confidence and save time by not looking for obscure machines to recreate the problem. With the latest Electron SDK and Sentry, you can easily uncover the who, what, when, where, and why behind every issue.
Get started with Sentry for Electron and drop us a line on GitHub, Twitter, or our Discord. And if you’re new to Sentry, you can try it for free today or write to sales@sentry.io to get started.


