What makes JavaScript great is also what makes it frustrating to debug. Its asynchronous nature makes it easy to manipulate the DOM in response to user events, but it also makes it difficult to locate problems. And JavaScript’s ubiquity has resulted in a variety of runtimes (e.g. Chromium’s V8, Safari’s JavaScriptCore, and Firefox’s SpiderMonkey) but having so many platforms can cause dizzying idiosyncracies — all of which need to be supported equally.
This makes pinning down the root cause of your JavaScript errors difficult. Is it a memory leak? Browser-specific bug? Or maybe you referenced the wrong value of this? And while there are options to debug your JavaScript, none of them are particularly pleasant:
Reproducing the issue is the equivalent of cooking a poorly received dinner again just to taste what went wrong. And it’s borderline impossible to reproduce the exact conditions of runtime environments, hardware, and network inconsistencies.
While console.log is great if you’re debugging locally, it’s not really helpful if you can’t reproduce it — or if you want to debug in production. That’s because logging merely identifies where in the codebase you are — but not what the problem is.
If you have managed to successfully reproduce a bug, in-browser debugging tools are the next step, but if you don’t have source maps available in production, good luck finding the root cause as you squint at minified JavaScript and opaque error codes.
It’s Ok To Be Lazy
Let’s be honest: you didn’t get this far by working hard. You did it by figuring out which tools can do the hard work for you. And Sentry’s suite of monitoring tools seamlessly hooks into your runtime environment to do the heavy lifting of debugging for you:
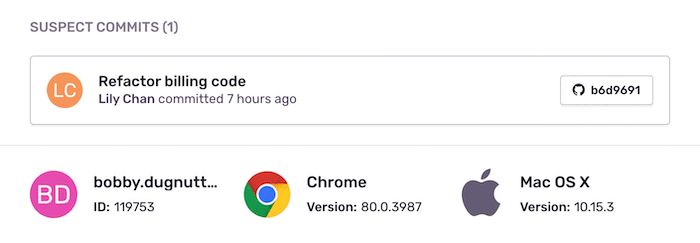
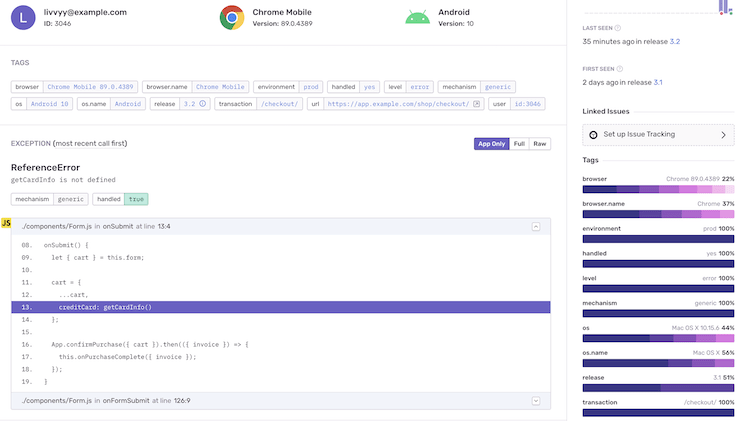
Sentry for JavaScript gives you complete context in the form of full stack traces, support for source maps that unminify your code, and direct integration with your source code management tool to help you identify the commit that broke your code.

Suspect commits show you the commit that introduced the error.
Our Issue Details page gives you the device, OS, browser of your user to give you full visibility into what led up to your JavaScript incident. And if you are using console.log to debug in production, we can capture breadcrumbs to create the trail of events that happened prior to an issue — then use our rich, structured data to see beyond what any log can give you.
And with Discover, our intuitive query builder, you can debug with pre-built searches that filter your JavaScript events, unique errors, errors by URL, and client. Check out Discover’s debugging superpowers — and how we used it to root out our own 404 errors.
Brian Kernighan — the inventor of Unix — said the most effective debugging tool is careful thought. Well, Kernighan didn’t have to didn’t have to debug why a valid regular expression throws an exception on Safari — or deal with the rapid increase of JavaScript-driven web APIs. But with Sentry’s application monitoring tools, you can save your careful thought for where it belongs: your code, not your errors.


