I have used quite a few logging frameworks in the past such as Log4Net and Splunk. However, most of them aren’t particularly useful for tracking down errors and seeing how your service is performing. I started using Seq with Serilog when I was working at my last company and it is amazing what a difference it can make having useful searchable logs.
What is Seq?
Seq puts all your logs into a quick searchable system that allows you to easily track down bugs. This is what the Datalust team say about Seq.
Seq creates the visibility you need to quickly identify and diagnose problems in complex applications and microservices. Empower your team to build better software by centralizing, searching, and alerting on structured application logs.
Although Seq normally costs $660/year, it is free to use locally and now with Seq 5 it is free in production for single user licenses. The downside is that it doesn’t work with SSL on the free plan (unless you put it behind a reverse proxy). You can also use SSL directly with the Windows version and via nginx/load balancer with docker (Thanks Nicholas for the comment). It is great tool if you are a bootstrapping a startup.
Seq comes with a number of really useful features:
Structured logging
With structured logs you also get event data with it so you can better understand how the error occurred. You can also add to this data with your own properties.
For example, I have added my application UserId so I can identify which user made the request. This is the data that I get from one of my logs. This is just an info message but if it was an error it would contain the stack trace as well.
It is best practice not to log sensitive data to logs. If you are logging the request make sure you remove any sensitive data beforehand such as replacing the Auth token with stars as I have in this example.
Datalust have an example middleware for .Net Core that handles this by having a whitelist of headers.
I particularly like the fact that this middleware also logs the elapsed time for the request so you can easily filter for performance issues. This request took just 0.4111 ms, got to love .Net Core.
Advanced Searching and Filtering
Seq makes it easy to find errors and performance issues with its fast search and filtering abilities.
There are number of ways you can search in Seq. You can do a text search by just typing in the search box which will search the log title for a particular text.
You can also use a number functions as well such as StartsWith, EndsWith, Contains to help find a particular error. Such as:
Contains(RequestId, '0NVV3')
Or why not find all requests that are taking longer than 100ms
Elapsed > 100
You can find a list here of the built-in properties and functions.
You can also click on the ticks and crosses (see screenshot above) to either find or exclude values of a particular property. This is useful if you have lots of different applications logging to Seq.
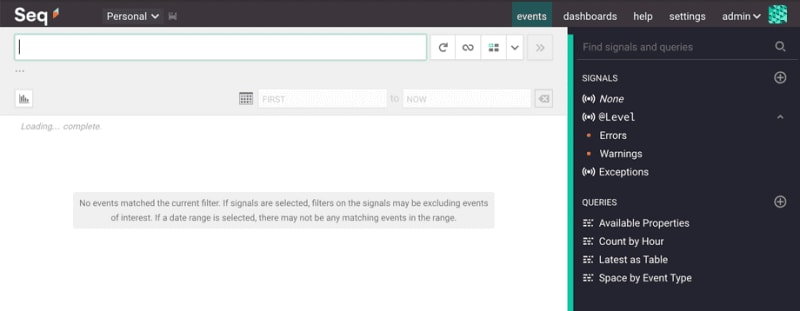
I like to create filters for each application so you can easily filter the logs. These can then be saved on the right-hand side for use later by clicking the >> button. Seq call these signals but they are basically just saved filters.
I particularly like the fact that Seq automatically creates groups for your signals or you can create your own.
Filters will also apply when you do additional searches so is a good way to filter down events if you are trying to find something.
Probably the highlight of searching in Seq is the ability to use SQL like expressions for extracting data. This also works for JSON blobs as well.
SELECT RequestHeaders.Referer FROM Stream
Real-time monitoring
By default you have to press the refresh button to get new events but if you want realtime event viewing then you can press the ∞ button. This is great if you are in the middle of a deployment, you can just filter by exceptions and then put on auto-refresh.
Dashboards and Charts
If you are going to be monitoring a service regularly then you can create a dashboard for it. Seq comes with a default overview dashboard but you can also create your own.
This can also be set to auto refresh.
Any SQL queries you perform can also be turned into quick graphs in the query view.
App integrations
If you weren’t already sold on Seq you can make it better with a number of app integrations. You can find the available packages on Nuget. The most commons ones are Email and Slack so you can get notified of errors.
Using Seq
Want to get started with Seq then the easiest way is to set it up with Docker. The official image is available over on Docker Hub.
This can be spun up locally as follows:
docker pull datalust/seq:latest

docker run \
  -e ACCEPT_EULA=Y \
  -v /path/to/seq/data:/data \
  -p 80:80 \
  -p 5341:5341 \
  datalust/seq:latest
Or if you prefer a docker-compose file:
version: '3'

services:
  seq:
    image: datalust/seq:latest
    ports:
      - 80:80
      - 5341:5341
    environment:
      ACCEPT_EULA: Y
Logging with Serilog in .Net Core
You can use Seq as sink for a number of different logging frameworks such as NLog, log4net. I prefer Serilog for structured logging. These are the NuGet packages you will want to install into your project:
- Serilog
- Serilog.Extensions.Logging
- Serilog.Settings.Configuration
- SerilogTimings
- Serilog.Sinks.Seq
- Serilog.Sinks.ColoredConsole
The last one is only really useful for development and as the name suggests give you nice coloured logs on the command line. Note: It is worth turning this off in production as I found logging to console can actually have a performance hit for high traffic applications.
You will need to add a section for Serilog to your app.settings:
  "Serilog": {
    "Using": [
      "Serilog.Sinks.ColoredConsole",
      "Serilog.Sinks.Seq",
    ],
    "MinimumLevel": {
      "Default": "Information",
      "Override": {
        "Microsoft": "Warning",
        "System": "Warning"
      }
    },
    "WriteTo": [
      {
        "Name": "ColoredConsole",
        "Args": {
          "restrictedToMinimumLevel": "Information"
        }
      },
      {
        "Name": "Seq",
        "Args": {
          "serverUrl": "http://localhost:5341",
          "restrictedToMinimumLevel": "Information",
          "apiKey": "your-seq-api-key"
        }
      }
    ],
    "Enrich": ["FromLogContext"],
    "Properties": {
      "ApplicationName": "Your.Api"
    }
  }
It is recommended that you set up an API key for each application that will be logging to Seq. It is also worth setting the application name that will be shown in Seq as shown at the bottom.
In you .Net application you just specify the logger in your Startup.cs
 public class Startup
    {
        public IConfiguration Configuration { get; }

        public Serilog.ILogger Logger { get; }

        public Startup(IHostingEnvironment env)
        {
            Configuration =
                new ConfigurationBuilder()
                .SetBasePath(env.ContentRootPath)
                .AddJsonFile("appsettings.json", optional : false, reloadOnChange : true)
                .AddJsonFile($"appsettings.{env.EnvironmentName}.json", optional : true)
                .AddJsonFile($"appsettings.local.json", optional : true)
                .AddEnvironmentVariables(prefix: "ASPNETCORE_")
                .AddEnvironmentVariables(prefix: "API_")
                .Build();

            Logger = new LoggerConfiguration()
                .ReadFrom.Configuration(Configuration)
                .Destructure.AsScalar<JObject>()
                .Destructure.AsScalar<JArray>()
                .Enrich.FromLogContext()
                .CreateLogger();

            // Rest of your startup config
        }

        public void ConfigureServices(IServiceCollection services)
        {
            services.AddSingleton<Serilog.ILogger>(Logger);

            // Other services
        }

        public void Configure(IApplicationBuilder app, IHostingEnvironment env, ILoggerFactory loggerFactory)
        {
            loggerFactory.AddSerilog(Logger);

            // Other settings here.

            Logger.Information("Application started");
        }
If you want a working version to get started DataLust provide a great on GitHub.
Timing operations
You may have noticed one of the packages I got you to install above was SerilogTimings. This is a great package if you are trying to measure performance of certain methods or lines of code in your system.
You will need to import the packages when you want to use them
using SerilogTimings;
using SerilogTimings.Extensions;
Then you can just wrap what you want to time in a using.
using (_logger.TimeOperation("Getting data from the database"))
{
    // Some code that is taking a while
}
Then you will get a log in Seq such as Getting data from the database completed in 3506.6 ms. Obviously you don’t want to wrap everything in timings as it may cause a performance hit in itself but it is useful for highlighting suspected performance issues.
Specifying properties in log text.
I often see people getting started with Serilog writing logs like this:
_logger.Information($"Finished parsing data for file {fileName}");
The problem with doing it this way is that Seq won’t know that “Finished parsing data for file clients.csv” and “Finished parsing data for file candidates.csv” were triggered by the same log line. Which means the event type for both events will be different and therefore you are stuck using text searching to find these events.
You should be writing your logs like this:
_logger.Information("Finished parsing data for file {fileName}", fileName);
That way serilog will create a property for fileName in the structured data and all events will have the same event type.
Same goes for errors too. Make sure you add a message when logging the error so they can be given the same event type.
_logger.Error(ex, "Error occurred parsing data for file {fileName}", fileName);
You can also add additional properties to give your log more context. You can do this without having to add it to the log message.
using(LogContext.PushProperty("RowsParsed", rows))
using(LogContext.PushProperty("ColumnsParsed", columns))
{
    _logger.Information("Finished parsing data for file {fileName}", fileName);
}
In the above example data from rows and columns will then be added as properties of the log event in the RowsParsed and ColumnsParsed properties.
Overriding variables using Docker
If you are deploying your application using Docker you will need to override the settings in app.settings at some point. You can do this with environment variables. In my example above you will notice I set an environment variable prefix.
.AddEnvironmentVariables(prefix: "API_")
This means it will only pickup environment variables that start with this prefix. Here are some environment variables you will want to set:
API_Serilog __WriteTo__ 1 __Args__ serverUrl
API_Serilog __WriteTo__ 1 __Args__ apiKey
API_Serilog __WriteTo__ 1 __Args__ restrictedToMinimumLevel
Note the 1 in the above variables corresponds to the position of the settings in the JSON array (with the array starting at 0).
Setting up Seq in AWS
As I mentioned above, as of Seq 5, you can now use Seq in production for free if you only have one user. The downside is the free version doesn’t support SSL but I guess you could run it behind an Nginx reverse proxy with SSL if you wanted.
The following instructions will get Seq up and running with SSL set up but depending on your uses you might want to run it behind a VPN.
Create a VPC
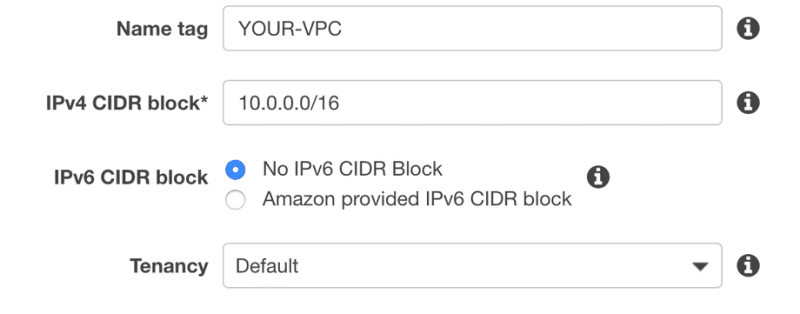
If you haven’t got one already for your application you will need to create a VPC from the VPC Dashboard. Give your VPC a name and then just use the default 10.0.0.0/16 for the IPV4 CIDR block.
Create public subnets
Next you need to create 2 public subnets on the Subnets page. We need 2 as we are going to be using an application load balancer to provide SSL.
You should give your Public Subnets names such as Public Subnet 1 and Public Subnet 2, with the IPv4 CIDR blocks such as 10.0.0.0/24 and 10.0.1.0/24.
It is important to pick different availability zones as otherwise you will have problems with the application load balancer later.
Create an internet gateway
You need to create an internet gateway so that your subnets have access to the internet and is accessible. Just give it a name and click create.
Pick your newly created internet gateway and from the Actions menu select Attach to VPC and pick your VPC from the next screen.
Route tables
You now need to set up the route tables so that your subnets have access to the newly created internet gateway.
Go to Route Tables and find the one that relates to your VPC ID.
Go to Actions > Edit subnet associations. Then pick your two public subnet you created earlier.
Next you need to edit the route table and add one with a Destination of 0.0.0.0/0 and make your internet gateway the target. It should look like this when you are done.
Security Groups
Still on the VPC Dashboard page go to Security groups. Find the default security group associated with your VPC. We need to add inbound rules for port 443 so you can access Seq over SSL from the internet. You need to add in a Custom TCP rule for port 443 to anywhere. It should look like this:
Create ECS Cluster
We are going to be using the official docker container and hosting it using ECS. First step we need to create an ECS cluster. Find the ECS service in AWS and click Create Cluster.
- Pick the EC2 Linux + Networking option.
- Give your cluster a name.
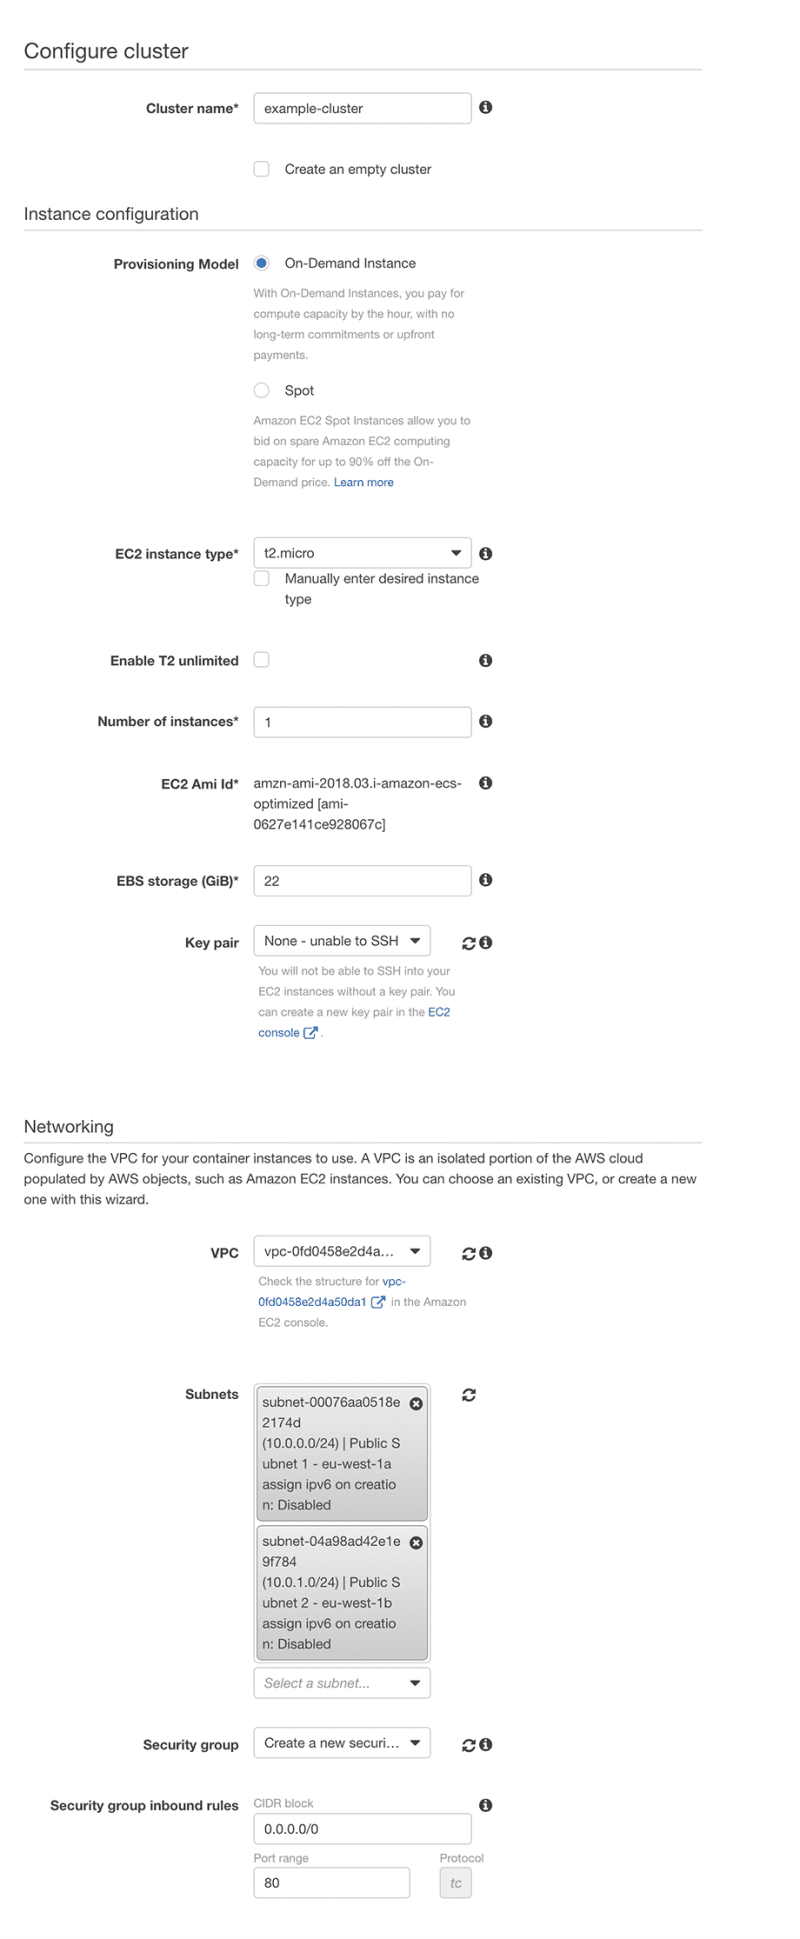
- Pick the On-Demand instance and pick an instance type of t2.micro
Under the VPC options you will need to pick your VPC, both subnets and then choose to create a new security group with port 80.
Your settings should look like this:
If you are in the first year of using AWS and don’t have another t2.micro then you should get this instance for free.
Create Application Load Balancer
We are going to use an application load balancer so that we can provide Seq over SSL. SSL will terminate at the load balancer so Seq will still be running on port 80. If you use the Windows version of Seq you can set SSL up on the Windows server and then connect with port 443 instead.
Go to the EC2 page and pick Load Balancers from the left hand menu.
Click Create Load Balancer and choose Application Load Balancer.
You need to set up the load balancer to listen in port 443.
Then pick your VPC and assign your 2 subnets we created earlier.
On your next screen you need to pick your SSL certificate. If you don’t have one for your domain you can create one with Amazon’s ACM.
You should see a Request a new certificate from ACM link. If you need a new certificate you will want to add yourdomain.com and *.yourdomain.com.
The certificate will need to be created in the same region as your servers.
If you get an error when creating a SSL certificate you may need to contact Amazon to have your quota updated.
You are supposed to be able to create 100 certificates for free but it looks like the default is set to 0. While you are there make sure they up your quota for N.Virginia as well as you will need this if you plan on using CloudFront in the future.
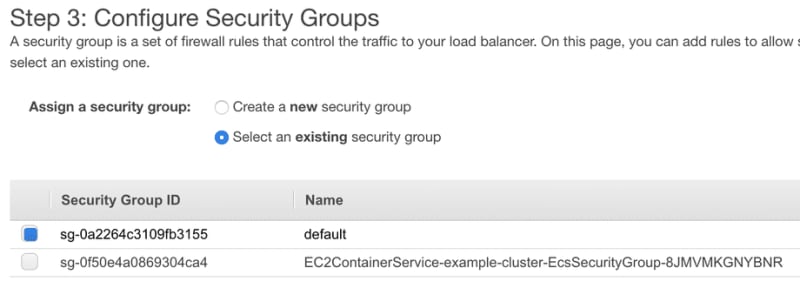
On the next screen you will need to pick your security group. If you have been following along you should have 2 security groups. Pick the one for your VPC as this will allow 443 access from the internet.
We then need to set up the routing targets. You need specify Target type as Instance and configure it for port 80. Remember Seq is still running on port 80 in our docker container.
Finally we add our instance to the registered instances.
The you just need to review and click Create.
Configure Cluster Security Group
To make our set up a little more secure we are going to change the security group settings for our cluster to only allow traffic from the load balancer.
To do this go to the EC2 page and click on Security Groups in the left hand menu.
Find your cluster security group. It should have a group name such as EC2ContainerService- cluster name -EcsSecurityGroup…
The inbound rules will currently be set up to accept traffic on port 80 from anywhere (0.0.0.0/0). We are going to change this to only accept traffic from the default security group being used by the load balancer.
Create Seq ECR Repository
We are going to upload the official docker image to Amazon docker repository so we can create a task from it. Go to ECS page and then repositories and create a new one called seq.
You will then be given instructions on how you can log in. These instructions assume you have got the amazon cli installed and have used it before.
Login to Amazon ECR.
$(aws ecr get-login --no-include-email --region eu-west-1)
Tag Official Datalust image that we pulled down earlier. Note, you will need to use your own address here.
docker tag datalust/seq:latest 11111111111.dkr.ecr.eu-west-1.amazonaws.com/seq:latest
Then we can push it up to your repository:
docker push 11111111111.dkr.ecr.eu-west-1.amazonaws.com/seq:latest
Depending on your internet connection it might take a little while to push the image up as it is over 200Mb.
Create Task
Once the image has been uploaded we need to create our task. This is where we set up the environment variables.
- Go to Task Definitions and click Create new Task Definition.
- Choose EC2 not Fargate for this.
- Pick a name for your Task like “seq”
- Set memory to something like 300 MiB
To make sure data persists we are going tell the container to store data in the EC2 Home directory. However, if you care about keeping the logs you might want to look in other volume mechanisms.
- Click Add volume
- Set name to Data
- Set Source Path to /home/ec2-user
Next we are going to add the container.
- Click Add Container
- Give the container a name, like “seq”
- Set the image to address of your image we uploaded e.g. 11111111111.dkr.ecr.eu-west-1.amazonaws.com/seq:latest
- Set a 300 MiB memory limit
- Set Port Mappings to Host Port = 80 Container Port = 80
- Scroll down to environment variables and set the key ACCEPT_EULA with value Y.
- Then Click Add.
- Scroll down to Storage and Logging > Mount points and select the Data volume we created earlier.
- Set the container path to /data
Finally click Create.
Create Service
We need to create a service to run our task. Go to clusters and pick the one we created.
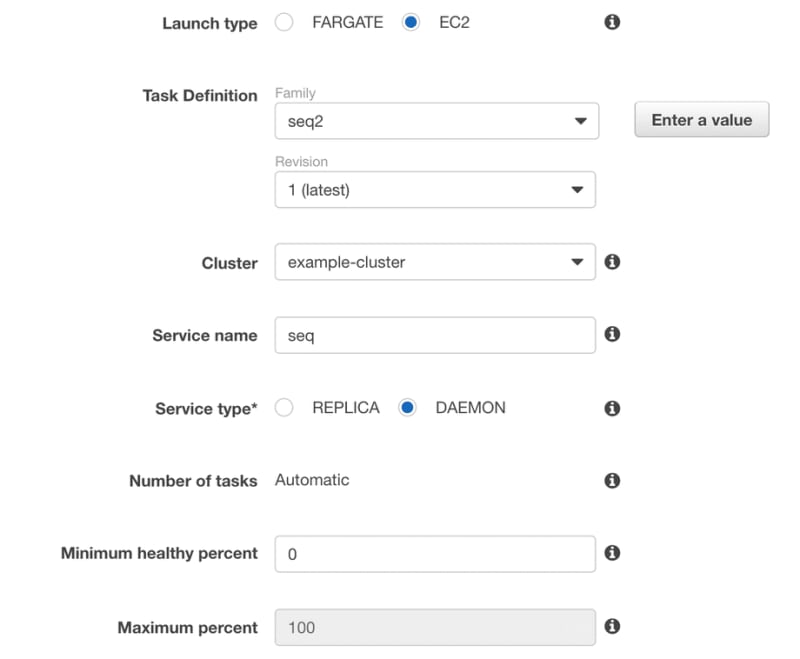
On the Services tab click Create, you will then need the following settings:
- Launch type: EC2
- Task Definition: Pick the Seq task we just created
- Cluster: should already be selected
- Service Name: seq
- Service Type: DAEMON
Then keep the rest as defaults.
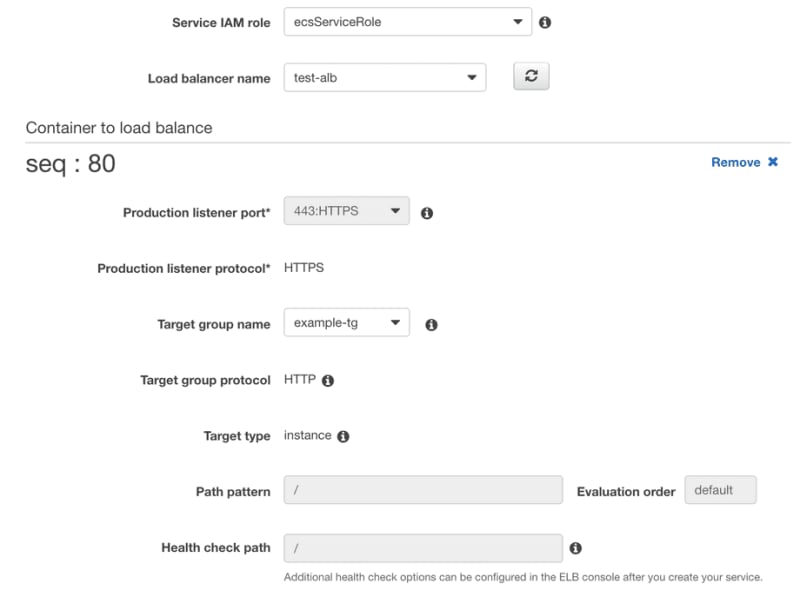
On the next screen set Load Balancer to Application Load Balancer and select the load balancer we created earlier.
You will need to Add the container port to the load balancer and pick the target group we created earlier.
Finally click through and create your service. After a minute or so your service should be up and running.
Viewing Seq
You should now have Seq running on an EC2 instance. We can access it via the load balancer URL.
Go to EC2 page and scroll down to Load Balancers on the left hand side. Find the load balancer we created earlier and find the DNS Name address shown in the description.
You should be able to go to https:// in your browser. You will get an invalid security certificate warning because it using your certificate for your domain. Bypass this and you should see Seq load up.
The first thing you want to do is enable authentication so other users can’t see your logs. This can be done under Settings > Users.
Route 53 or Alternative DNS
To get it all working with your domain you need to create an A Record and point to this address.
If you are using Route 53 then you can set up an A record and set Alias as Yes. You then just need to pick your load balancer from the list.
Conclusion
Seq is awesome and the fact you can now run it for free in production is a big win. Have you had the chance to use Seq yet, let us know your favourite features in the comments.


