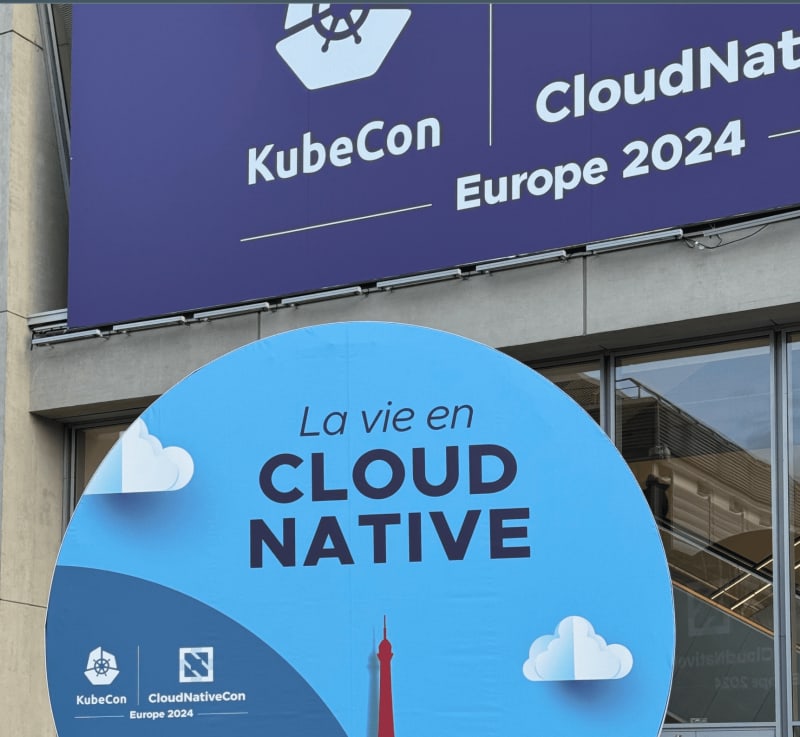
Greetings from KubeCon + CloudNativeCon Europe! It was a wild and awesome ride last week! Ken and I had a blast at both the Co-Located Observability Day on Tuesday, as well as during the main conference! I have a lot to share. Here’s a recap of how the observability community has grown in Europe since last year.
KubeCon + CloudNativeCon Venue
KubeCon + CloudNativeCon Europe 2024 was in Paris the week of March 18th. I thought it would be interesting to recap some of the events from the Tracetest team’s perspective with an eye towards Observability.
First, the venue Paris Expo Porte de Versailles, was beautiful. Our team had a booth on the main floor, but also attended the co-located Observability Day event prior to the main conference.
The Observability Day got two rooms this year! Finally! Here’s what the main room looked like at 8:30 before it got packed to the brim when the talks started. Absolutely massive!
Observability Day and OpenTelemetry
Let me start off by discussing Observability Day. The agenda was packed with informative sessions and discussions that shed light on the latest trends and advancements in observability.
The CNCF finally provided a second room to have more sessions and accommodate the number of interested people!
Opening session by OpenTelemetry community committee members
Austin Parker, Honeycomb, started off the co-located event. He covered OpenTelemetry project updates and future goals.
Most notable were updates to:
- Stability
- Events & RUM
- Continuous profiling
Since last Observability Day 2023 in Chicago, 4 more languages have been marked stable!
Events will be optimized for real-user monitoring!
Profiling will be added this year!
But the biggest bombshell is that OpenTelemetry has applied for graduation in the CNCF.
Eduardo Silva, Chronosphere, then took the stage to talk about updates happening in the world of FluentBit.
He covered latest updates and the roadmap for 2024.
Pavol Loffay (Red Hat) and Jonah Kowall (Aiven) covered exciting updates to Jaeger.
The roadmap looks awesome!
As do the v2 goals!
This was a great segue into the more technical presentations of the day.
We did catch all the sessions at Observability Day, but I want to share some of my favorites with you.
Hey OpenTelemetry, where’s my error!?
Dude, Where’s My Error?: How OpenTelemetry Records Errors, and Why It Does It Like That — The session presented by Reese Lee, New Relic & Adriana Villela, ServiceNow.
They emphasized the importance of tracking errors and understanding system functionality for user satisfaction. They used a demo to showcase OTel's error logging, metadata-enhanced troubleshooting, and the difference between errors and exceptions. The session explained error visualization across different backends and the effect of different span kinds on error reporting.
How to think about overhead?
How to Think About Instrumentation Overhead — Jason Plumb (Splunk) did an amazing talk on instrumentation overhead in an observability context. Novice observability practitioners who were previously overly obsessed with performance had approached instrumentation with skepticism due to concerns about latency degradation or resource consumption.
The causes of overhead were covered, illustrating why it is difficult to measure and predict. Jason also showcased practical techniques for understanding overhead in one's environment and strategies for coping with it were presented.
FluentBit vs. OpenTelemetry Collector
Telemetry Showdown: Fluent Bit Vs. OpenTelemetry Collector - a Comprehensive Benchmark Analysis — Henrik Rexed, Dynatrace.
In a push to standardize observability practices, the cloud-native community has embraced OpenTelemetry, offering a unified framework for metrics, logs, and traces. In the past log processing relied on agents like Fluentd, evolving into FluentBit. With FluentBit's recent expansion to support additional signals and the rise of OpenTelemetry Collector, a question arises: "Which is the superior choice for performance?"
Henrik explained the performance differences, ease of use, compatibility, and more!
Improving Serverless monitoring at Google
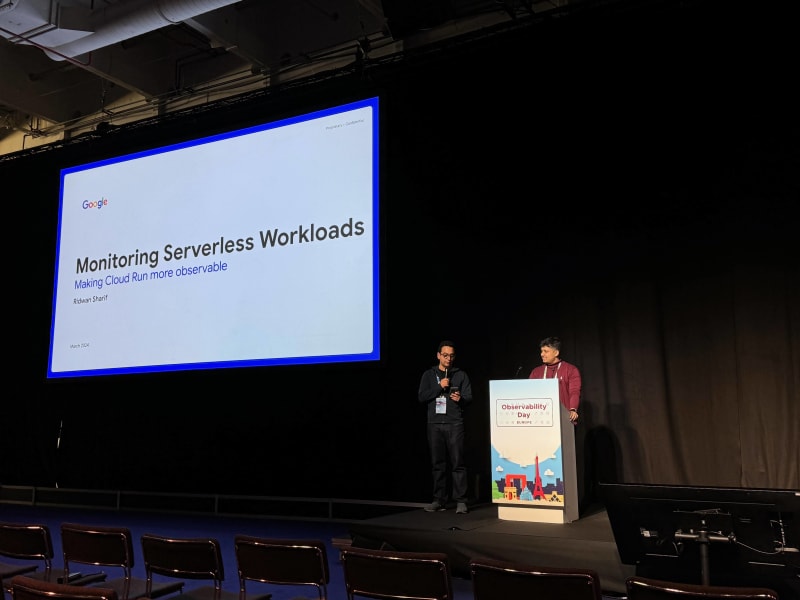
Monitoring Serverless Workloads with OpenTelemetry and Prometheus - Ridwan Sharif, Google.
In this presentation Ridwan explained the challenge with observability and serverless platforms. To enable OpenTelemetry tracing and Prometheus-based metrics in Google's Cloud Run they had to implement new updates to sidecars in Cloud Run.
This enabled flushing push-based OpenTelemetry traces before containers were killed. But also scraping with Prometheus. This presentation explains how these improvements to Cloud Run enabled the use of open-source observability tooling to improve serverless observability.
What's a good OpenTelemetry mindset?
Shift Into an Observability Mindset with OpenTelemetry - Daniel Gomez Blanco, Skyscanner.
Daniel covered an amazing topic. Embracing observability in your organization.
To do so, you must shift your mindset to rethink monitoring and debugging practices. This means moving to OpenTelemetry and communicating the value of OpenTelemetry as the ideal tool for the job both today and moving forward. Daniel also covered adoption best practices as well. Can't wait to get the recording and re-watch this amazing talk.
How to build dynamic OpenTelemetry Collector configs?
OpAMP in Action: User Configurable Observability Pipelines - Srikanth Chekuri, SigNoz.
Observability pipelines using OpenTelemetry Collector can't be configured dynamically. This means you need to restart the collector when the config is changed. With OpAMP you can bypass this to build dynamic user configurable observability pipelines!
Observability Vendors at KubeCon
Moving on, let's explore the diverse range of observability vendors present at KubeCon in Paris this year. I counted 29 vendors who set up booths, each offering unique solutions and perspectives.
- Tracetest
- OpenTelemetry
- Honeycomb
- Grafana
- Datadog
- OpenSearch
- Tyk
- Prometheus
- Dynatrace
- New Relic
- Splunk
- Elastic
- Edge Delta
- Chronosphere
- Calyptia
- Victoria Metrics
- Logz
- Fluentbit
- Lumigo
- Coralogix
- Axiom
- StackState
- Sentry
- Dash0
- Highlight
- ManageEngine
- Kloudfuse
- Axoflow
- Groundcover
As promised, I have compiled a collection of photos to give you a glimpse into the vibrant atmosphere and impressive setups.
Check out the video on YouTube, here.
Interviewing OpenTelemetry Maintainers, Approvers, and Contributors
I had the chance to talk to OpenTelemetry community members about their experience and work in the community. The interviews include Juliano Costa (OpenTelemetry Demo maintainer), Kayla Reopelle (OpenTelemetry Ruby Approver), and Adriana Villela (OpenTelemetry Contributor).
View the video with OpenTelemetry Demo Maintainer Juliano Costa, here.
Stay tuned for a complete case study with the OpenTelemetry maintainers!
Fostering a Sense of Community
In the world of observability, it's super cool to see how vendors, even while competing, come together like old friends. It’s awesome to witness these bonds and collabs, giving the whole scene a cozy, tight-knit vibe.
Need proof? Check out how folks from ServiceNow and New Relic teamed up for sessions, not to mention how Google engineers are committed to open-source observability!
And then there’s us at Tracetest, playing it cool like Switzerland in the midst of OpenTelemetry. We're all about bridging gaps, working with everyone to bring trace-based testing into the spotlight. It's all about fostering that spirit of unity and teamwork!
Where do we go from now?
Now once we're all back from KubeCon in Paris, let’s continue the discussion and try contributing even more to the OpenTelemetry project. The OpenTelemetry project has filed for graduation in the CNCF.
Our team has been active in the last year, with numerous PRs, both code contributions and content for the OpenTelemetry blog. I am hoping we can ramp up even more and help the developer community embrace OpenTelemetry, making it easier than ever to get started.
What do you think?
I’ve shared my thoughts and experiences from KubeCon. Let me hear your ideas as well! What topics would you like to see covered? Feel free to reach out and share your suggestions!
Do you want us to contribute to something specific in the OpenTelemetry project?
Do you need a specific feature in Tracetest to help you work with OpenTelemetry?
There are no bad ideas!
I’m eager to hear your thoughts. Feel free to reach out to me any way you prefer! I am active on LinkedIn daily and happy to answer questions or just chat about OTel.
See you at KubeCon North America in Salt Lake City!
To wrap it up, KubeCon was a super exciting experience. The observability vendors showed off their skills, and the awesome sense of community was all about working together and contributing to OpenTelemetry.
If you enjoyed this post, share it with your friends!
Feel free to connect with us on social media, join our Slack community, and give us a ⭐ on GitHub.


