With our successful v0.8 release out the door in November, and the holidays fast approaching, the Tracetest team focused on a new release in December to ring in the New Year. We decided to rethink how to configure trace data stores and make it part of the Web UI. This makes installing Tracetest and tying it to your OpenTelemetry-compatible tracing system easier.
Trace-Based Testing via Tracetest
First, let's make sure you know what Tracetest is and what it does. Tracetest enables you to write trace-based tests against your distributed application. These tests utilize the distributed tracing you have enabled. You get operational observability to also enable rich system, integration, and end-to-end testing across your microservice-based application.
A typical test tool can trigger a transaction and test against the response. Tracetest triggers a transaction against the system under test and allows you to assert against both the response and any of the activity captured throughout the entire distributed trace. It allows you to verify the complete process, not just the response!
Installing Tracetest
Tracetest is open source and can be installed with either Docker or Kubernetes. It only has a couple of integration points needed to enable you to test your system.
First, Tracetest needs network access so it can reach out and trigger an action against your distributed system. We have multiple means to do this: supporting REST calls, gRPC calls, or importing a trigger from Postman or even a curl statement. There is a flexible plugin framework that will allow other trigger types, such as putting a message on an async message queue, to be supported in the future.
Secondly, Tracetest needs to be able to get the trace associated with the test that was triggered against your application. Tracetest supports a number of trace data stores natively, such as OpenSearch, Grafana Tempo, Jaeger, and others. In addition, if you are using the OpenTelemetry collector, you can easily define an additional pipeline that will route the spans from a Tracetest test to the Tracetest server, while continuing to send all your trace data to your existing inhouse data store or to a vendor such as DataDog, New Relic, or Lightstep.
What Our Users Told Us
Over the past few months, we noticed that most of the questions in our Discord channel were related to this second integration point, i.e. setting up the connection to the trace data store.
With our previous versions, installing the Tracetest server via the CLI walked you through the selection of different trace data stores and prompted for the needed configuration variables based on this choice. If you had all the needed information about the trace data store and entered all the data correctly, everything would work!
If you did not have the configuration information on hand, or you, perish the thought, made a typo or entered the wrong configuration information, the Tracetest server would issue an error message and die. Helping users determine the cause of the error and correcting it was our #1 support issue. We decided to make a New Year's resolution to resolve this issue.
Making Tracetest Easy to Configure
To correct this issue, we have now moved the configuration of the trace data store so it is done "post install" via the user interface, or, with experienced users, via our CLI. By deferring the configuration to after the installation, we make successfully installing Tracetest a breeze.
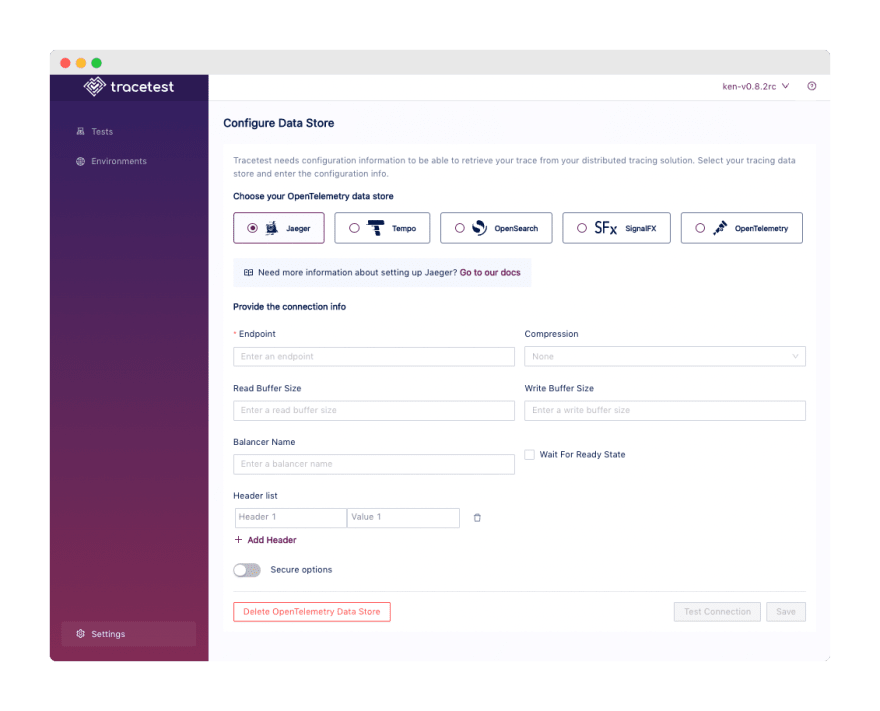
Once it is installed and you access the UI, you are in "no trace mode" and are prompted to configure the trace data store. If you do not know the details, you can still run tests, but they will not have the trace and will be limited to "response-based tests". When you elect to configure the trace data store, you will be presented with a configuration screen:
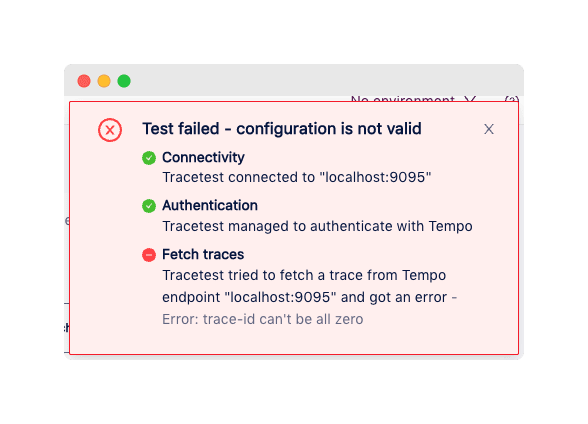
From this screen, you can select the type of trace data store you are using and configure it. When you have entered the configuration details, you can press the "Test Connection" button at the bottom right. This will trigger the Tracetest server to run a series of tests using the configuration values you entered. Tracetest will give you the response from the tests, which hopefully all passed! If one or more did not, you will have detailed information about what Tracetest tried, what failed, and what the error message was. This detailed information should assist you in knowing what worked and what failed, aiding troubleshooting.
We also wanted to enable you to configure a server via the CLI. You can build the configuration file for a trace data store based on documentation here. Using this file, you can alter the trace data store configuration with the tracetest CLI using the following syntax:
tracetest datastore apply -f my/data-store/file/location.yaml
Let Us Know if We Were Successful
This release is all about making Tracetest much easier to install and configure initially. We think we nailed it with the in-app configuration and the "test connection" capability, but the proof will be YOUR experience. Ready to give the new install and configuration of Tracetest a try in your environment? Check out our easy download, then configure your trace data store via our new in-app experience. And, most importantly, let us know how it goes!
Any issues can be created in Github, and you can communicate directly with the team in Discord. Open-source projects such as Tracetest depend on the input and support of the community and we need YOUR involvement! If you are a fan of Tracetest - give us a star on Github.
Looking forward to 2023 being a great year for the Tracetest project, and we hope, together with your help, we can bring better testing across your distributed application.


