
A typical requirement for spreadsheets is to use them to create financial applications to track company and personal finances.
In this blog, we will build a simple yet fully functional budgeting application using JavaScript and SpreadJS, our JavaScript spreadsheet, and SpreadJS's TableSheet feature. You could expand upon this example and use it for your personal financial tracking.
Let's get started!
- Application Breakdown
- Create a Template for the Header
- Loading the Template
- Sourcing Data
- Loading Data into DataManager
- Creating a TableSheet and Setting Options
- Creating Conditional Formatting Rules and Formatters
- Creating a DataManager View
- Apply Free Header Area and Set Data View
You can download the sample for this blog and follow along here.
Application Breakdown
In this application, we will use a TableSheet to show the data, but we also have some other data and formatting to apply, which we will do in a Free Header Area. This is essentially a normal spreadsheet used as the header for a TableSheet, so we can customize cell formatting, sizing, and data without affecting the TableSheet data. We can also reference that TableSheet data within the header to provide more information and calculations.
To make things easier, we can create two separate SpreadJS workbooks:
- One workbook to load a template into and then save a single sheet to JSON
- Another workbook to create a TableSheet in
Create a Template for the Header
For this application, I have created a template purely in the SpreadJS Designer:
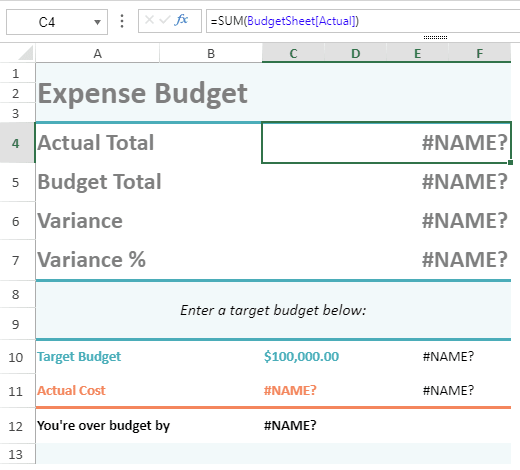
This template has many “#NAME?” errors, as the formulas reference a TableSheet we have yet to create. In this case, we know that the TableSheet will be called “BudgetSheet” and we know what data points are going to be available, so these are the formulas for each cell:
- Actual Total =SUM(BudgetSheet[Actual])
- Budget Total =SUM(BudgetSheet[Budget])
- Variance =SUM(BudgetSheet[Difference])
- Variance % =Variance / Budget Total
- Target Budget Sparkline =HBARSPARKLINE(ROUND(C10/MAX(C10,C11),2),"rgb(39,173,185)",FALSE)
- Actual Cost Sparkline =HBARSPARKLINE(ROUND(C11/MAX(C10,C11),2),"rgb(255,136,91)",FALSE)
- Over Budget = Target Budget - Actual Cost
Loading the Template
It should be noted that you can create a template just in code by setting values and styles for a sheet you created, and you would not have to worry about loading a template in a separate workbook and creating a sheet JSON. We can save the template from the Designer as a workbook SSJSON file. We can export this as a JS file that we can then reference in the HTML:
<script src="./template/BudgetHeader.js" type="text/javascript"></script>
Once we have that referenced, we can simply refer to it with the variable BudgetHeader. Now we can load that JSON into a hidden SpreadJS workbook instance (just to convert the JSON). Once it is loaded, you can select the specific sheet and convert that to JSON, which we will use later for setting the header template:
   window.onload = function() {
        var templateSpread = new GC.Spread.Sheets.Workbook(document.getElementById("ssTemplate"), { sheetCount: 0 });
        createSheetTemplate(templateSpread);
    };

    // Load the SSJSON into a spread instance to convert
    // a single sheet to a JSON format for use later
    function createSheetTemplate(spread) {
        spread.suspendPaint();
        spread.fromJSON(BudgetHeader);
        spread.resumePaint();
        var budgetHeaderSheet = spread.getSheet(0);
        budgetHeaderSheet.options.keepUnknownFormulas = true;
        var template = budgetHeaderSheet.toJSON();
        initSpread(template);
    }

    // Perform the initialization of the TableSheet workbook
    function initSpread(template) {
        var spread = new GC.Spread.Sheets.Workbook(document.getElementById("ss"), { sheetCount: 0 });
        spread.suspendPaint();
        spread.options.autoFitType = GC.Spread.Sheets.AutoFitType.cellWithHeader;
        (...)
    }
Sourcing Data
For the purposes of this simple application, we will just be loading data from a JSON file, but you could load data from a specific URL if you wanted to.
Load Data into DataManager
Now we need to load the data into the SpreadJS DataManager. To do that, we need to create the DataManager and add a table to it, in this case, referencing the JSON file that we created earlier:
    // Initialize the data manager and add a table
    var dataManager = spread.dataManager();

    var budgetTable = dataManager.addTable("budgetTable", {
        remote: {
            read: {
                url: "./data/Budget.json"
            }
        }
    });
This will add a new table called “budgetTable” containing the data from the JSON we provided.
Creating a TableSheet and Setting Options
Once the table is created in the DataManager, we can add a new TableSheet to the workbook. We also need to set a few options, such as disabling the action column, disabling the new row button, and applying a theme to the sheet:
    // Add a new TableSheet to the workbook and set some options
    var budgetSheet = spread.addSheetTab(0, "BudgetSheet", GC.Spread.Sheets.SheetType.tableSheet);
    budgetSheet.options.allowAddNew = false;
    budgetSheet.actionColumn.options({ visible: false });
    budgetSheet.applyTableTheme(GC.Spread.Sheets.Tables.TableThemes.professional3);
Creating Conditional Formatting Rules and Formatters
In our TableSheet, we will be adding some data bar rules and formatting currency numbers so that we can create those rules and the formatter. In this case, we want a separate data bar rule for the budget and actual data points, with different colors and different directions:
    // Create Conditional Format DataBar Rules
    // DataBar rule for the Budget data point
    var budgetRule = {
        ruleType: "dataBarRule",
        color: "#FFD7C7",
        gradient: true
    };

    // DataBar rule for the Actual data point
    var actualRule = {
        ruleType: "dataBarRule",
        color: "#B1E9EE",
        gradient: true,
        barDirection: "rightToLeft"
    }
The currency format can just be a simple string that will be used to format numerical values:
    // A formatter for the currency values in the table
    var currencyFormatter = "$#,##0.00";
Creating a DataManager View
With the table set up, conditional rules, and formatters created, we can now create a view of the table. There are only 3 data points in our data source: Expense, Budget, and Actual. For this view, we also wanted to create some calculated columns for Difference, Difference %, and Variance. These calculated columns are created by using formulas within the value property of the column, and we can reference other data points using the “@” symbol. The formulas for each of these are as follows:
- Difference = Actual - Budget
- Difference % = (Actual - Budget) / Budget
- For variance, we will utilize the VARISPARKLINE sparkline function
We will also apply the currency formatter we created to each data point that is a monetary amount:
    // Create the view from the DataManager table we created earlier
    var budgetView = budgetTable.addView("budgetView", [
        { value: "Expense", style: {formatter: currencyFormatter}, width: 120 },
        { value: "Budget", style: {formatter: currencyFormatter}, width: 100, conditionalFormats: [budgetRule] },
        { value: "Actual", style: {formatter: currencyFormatter}, width: 100, conditionalFormats: [actualRule] },
        { value: "=[@Actual] - [@Budget]", caption: "Difference", style: {formatter: currencyFormatter}, width: 120 },
        { value: "=([@Actual] - [@Budget]) / [@Budget]", caption: "Difference %", style: {formatter: "[#27ADB9]0.0%  ▲;[#FF885B]0.0%  ▼"}, width: 140 },
        { value: "=VARISPARKLINE(ROUND((([@Actual] - [@Budget]) / [@Budget]), 3),,,,,,TRUE,\"#27ADB9\", \"#FF885B\"", caption: "Variance", width: 120 }
    ]);
This view would look something like this one when we set it:

Apply Free Header Area and Set Data View
The last step is to apply the sheet template we created earlier in this blog to the free header area and set the data view we just created. This can be done with just a couple of lines of code:
    // Set the free header area and the view we just created in the TableSheet
    budgetView.fetch().then(function() {
        budgetSheet.applyFreeHeaderArea(template);
        budgetSheet.setDataView(budgetView);
    });
Setting both the header area and the data view would result in this:

You have now successfully created a budgeting application using just SpreadJS and its TableSheet functionality!


