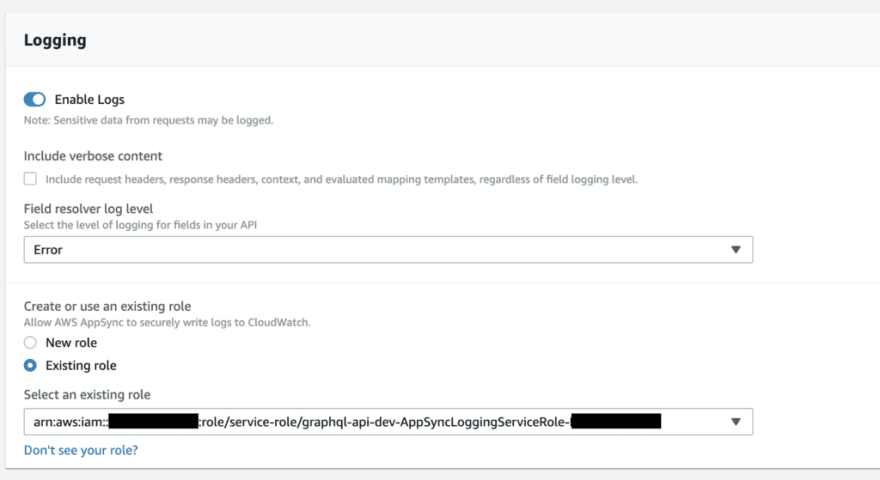
AppSync has built-in logging integration with CloudWatch Logs (see here for more details on the logging options).
You can set the Field resolver log level to NONE, ERROR or ALL.
When the field resolver log level is set to NONE or ERROR, you don’t get a lot of value from the AppSync logs. For example, this is what I see for a GraphQL request:
You can see the latency but have no way of figuring out what contributed towards that latency. Really, there’s not a lot you can do with the information get.
But if you set the field resolver log level to ALL, then you suddenly see EVERYTHING!
The request and response mapping for each resolver, and how long each of the fields took to resolve.
This is great!
But, given the amount of information that is sent to CloudWatch Logs, this has a non-trivial cost implication. As you can see below, CloudWatch Logs charges $0.50 per GB of data ingested. This is equivalent to the cost of 125,000 Query/Mutation requests to AppSync, and I bet those operations would generate a lot more than 1 GB of logs!
In practice, you wouldn’t want to leave the Field resolver log level at ALL in a production environment. The cost would be too significant.
Unfortunately, there is no built-in sampling support, unlike with X-Ray.
Sampling resolver logs via cron jobs
One workaround is to use Lambda functions to toggle the Field resolver log level between ALL and ERROR via a pair of cron jobs.
This is exactly what I did on a client project recently to keep a healthy balance between cost and having visibility into what my application is doing.
To do this, I configured two cron jobs (with Lambda).
turnOnResolverLogging:
  handler: functions/toggle-resolver-log-level.handler
  events:
    - schedule: cron(8 * * * ? *)
  environment:
    APPSYNC_API_ID: !GetAtt AppsyncapiGraphQlApi.ApiId
    FIELD_LOG_LEVEL: ALL
  iamRoleStatements:
    - Effect: Allow
      Action:
        - appsync:GetGraphqlApi
        - appsync:UpdateGraphqlApi
      Resource: !Ref AppsyncapiGraphQlApi
    - Effect: Allow
      Action: iam:PassRole
      Resource: !GetAtt AppSyncLoggingServiceRole.Arn
turnOffResolverLogging:
  handler: functions/toggle-resolver-log-level.handler
  events:
    - schedule: cron(10 * * * ? *)
  environment:
    APPSYNC_API_ID: !GetAtt AppsyncapiGraphQlApi.ApiId
    FIELD_LOG_LEVEL: ERROR
  iamRoleStatements:
    - Effect: Allow
      Action:
        - appsync:GetGraphqlApi
        - appsync:UpdateGraphqlApi
      Resource: !Ref AppsyncapiGraphQlApi
    - Effect: Allow
      Action: iam:PassRole
      Resource: !GetAtt AppSyncLoggingServiceRole.Arn
These cron jobs would run on the 8th and 10th minute of each hour, giving me 2 minutes worth of resolver logs per hour. This gives me resolver logs for roughly 3% of Query/Mutation operations.
The function looks like this:
const AppSync = require('aws-sdk/clients/appsync')
const appSync = new AppSync()
const { APPSYNC_API_ID, FIELD_LOG_LEVEL } = process.env
module.exports.handler = async (event) => {
  const resp = await appSync.getGraphqlApi({
    apiId: APPSYNC_API_ID
  }).promise()
const api = resp.graphqlApi
  api.logConfig.fieldLogLevel = FIELD_LOG_LEVEL
delete api.arn
  delete api.uris
  delete api.tags
await appSync.updateGraphqlApi(api).promise()
}
To make sure I don’t accidentally change any of the other configurations, I fetch the current API configuration first. But since the updateGraphqlApi request doesn’t accept arn, uris nor tags, I have to remove these or the request will fail validation.
But wait! What if I want to keep all the resolver logs in dev and only enable sampling in production?
Well, you can use the serverless-ifelse plugin to conditionally exclude these two functions for the dev stage, like this:
serverlessIfElse:
  - If: '"${self:custom.stage}" == "dev"'
    Exclude:
      - functions.turnOnResolverLogging
      - functions.turnOffResolverLogging
The approach I outlined above is simple and gives me a sufficient amount of resolver logs without blowing up my CloudWatch cost. However, if you want the sampling to be spread more evenly across the hours then you might consider this alternative—run a cron job every few minutes and have the Lambda function:
- set the resolver log level to
ALL - busy wait for, say 10 seconds
- set the resolver log level back to
ERROR
That way, you will have resolver logs for Query/Mutation requests for 10 seconds every few minutes instead of 2 minutes every hour.
Don’t forget to update log retention
Another important thing to remember is to update the log retention policy for your log groups. Because by default, CloudWatch Logs will never expire your logs and you will pay $0.03 per GB per month for an ever-increasing pile of logs that are less useful with every passing minute.
The best way to manage the log retention for all your log groups—past, present and future—is to deploy this SAR application to your region and let it do the rest.
This SAR application would update all your existing log groups during deployment. And when new log groups are created in the future, their retention policy will also be updated automatically.
Master AppSync and GraphQL
If you want to learn GraphQL and AppSync with a hands-on tutorial then please check out my new AppSync course where you will build a Twitter clone using a combination of AppSync, Lambda, DynamoDB, Cognito and Vue.js. You will learn about different GraphQL modelling techniques, how to debug resolvers, CI/CD, monitoring and alerting and much more.


