⚠ This has been written in early version of YugabyteDB
Since 2.14 copy progression is visible in pg_stat_progress_copy. Example:
clickbench=#

select to_char(
 100*bytes_processed::float/
 (case when bytes_total>0 then bytes_total end)
,'999.99') "%",* from pg_stat_progress_copy;

    %    |  pid  | datid |  datname   | relid |  command  |  type   |  yb_status  | bytes_processed | bytes_total | tuples_processed | tuples_excluded
---------+-------+-------+------------+-------+-----------+---------+-------------+-----------------+-------------+------------------+-----------------
    2.84 | 21228 | 18743 | clickbench | 18764 | COPY FROM | FILE    | IN PROGRESS |      2125660160 | 74807831229 |          2740000 |               0
         | 22605 | 18743 | clickbench | 18769 | COPY FROM | PROGRAM | SUCCESS     |         6229738 |           0 |                1 |               0
(2 rows)
The non-transactional writes have been extended to other statements than copy and the setting is yb_disable_transactional_writes. For bulk load where you don't want to check the existence of the row, you can also set yb_enable_upsert_mode=on to accelerate the inserts.
Original post
When you want to evaluate the migration from PostgreSQL to YugabyteDB you may:
- load metadata (DDL) from a pg_dump
- load data with pg_restore or parallel psql
- test the application
Here are some quick scripts that I've used for that. And it can give an idea of what can be done to import data from a http endpoint in JSON into a PostgreSQL table.
DDL changes
The DDL generated by pg_dump creates the table and then adds the primary key. This is fine in PostgreSQL as tables are heap tables and the primary key index is a secondary index. However, YugabyteDB tables are stored in LSM Tree organized (sharded by hash, range and sorted) according to the primary key. Similar to tables in MySQL, clustered indexes in SQL Server or Index Organized Tables in Oracle, but with horizontal partitioning to scale out. So, if you run the CREATE TABLE and ALTER TABLE to add the primary key, you will create them with a generated UUID, and then reorganize the tables. On empty tables, this is not a big deal but better do all in the create statement. One way to do that is using yb_dump, the Yugabyte fork of pg_dump, to export from PostgreSQL. But if you already have the .sql file, here is a quick awk to modify it:
awk '
# gather primary key definitions in pk[] and cancel lines that adds it later
/^ALTER TABLE ONLY/{last_alter_table=$NF}
/^ *ADD CONSTRAINT .* PRIMARY KEY /{sub(/ADD /,"");sub(/;$/,"");pk[last_alter_table]=$0",";$0=$0"\\r"}
# second pass (i.e when NR>FNR): add primary key definition to create table
NR > FNR && /^CREATE TABLE/{ print $0,pk[$3] > "schema_with_pk.sql" ; next}
# disable backfill for faster create index on empty tables
/^CREATE INDEX/ || /^CREATE UNIQUE INDEX/ { sub("INDEX","INDEX NONCONCURRENTLY") }
NR > FNR { print > "schema_with_pk.sql" }
' schema.sql schema.sql
This is a quick-and-dirty two-pass on the DDL to get the primary key definition, and then put it in the CREATE TABLE statement.
Note that I also change the CREATE INDEX to disable backfill when creating them in empty tables. More info about this in a previous blog post: https://dev.to/yugabyte/create-index-in-yugabytedb-online-or-fast-2dl3
DDL order
You will probably create the secondary indexes after the load, but I like to run the whole DDL once, before loading data, to see if there are some PostgreSQL features that we do not support yet. I split the DDL file to have only CREATE TABLE (with their primary key) before the load and all other CREATE or ALTER after loading the large tables.
Non transactional load
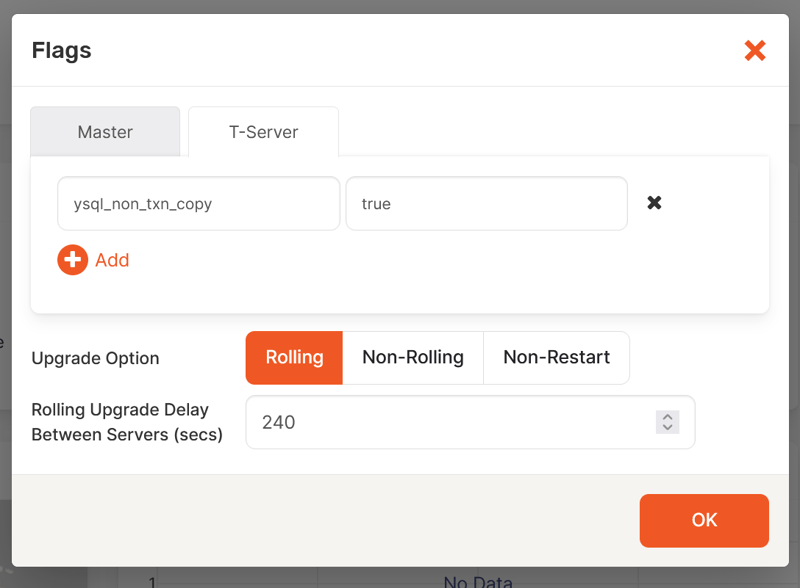
For the initial load, you can bypass the multi-row transactional layer (because nobody will query during the load so you can be loose on the A and I of ACID). This is done by setting ysql_non_txn_copy=true for the tserver:
This can make the load 2x faster but don't forget to put it back to its default value of ysql_non_txn_copy=false after the load.
Basically all rows will be inserted as single-row transactions
COPY progress
Then you may import terabytes of data. This takes time (there is work in progress to optimize this) and you probably want to see the progress. As we commit every 1000 rows by default (can be changed with rows_per_transaction) you can select count(*) but, that takes time on huge tables, requiring to increase the default timeout.
We have many statistics from the tablet server, exposed though the tserver endoint, like http://yb1.pachot.net:9000/metrics, as JSON. But for a PoC you may not have set any statistics collection and want a quick look at the statistics.
Here is a script to gather all tablet metrics into a temporary table:
-- create a temporary table to store the metrics:

drop table if exists my_tablet_metrics;
create temporary table if not exists my_tablet_metrics (
 table_id text,tablet_id text
 ,namespace text, table_name text
 ,metric text, value numeric
 ,tserver text
 ,timestamp timestamp default now()
);

-- gather the metrics from the tserver:

do $do$
 declare
  tserver record;
 begin
  -- gather the list of nodes and loop on them
  for tserver in (select * from yb_servers())
   loop
    -- use COPY from wget/jq to load the metrics
    execute format($copy$
     copy my_tablet_metrics(table_id,tablet_id
     ,namespace,table_name
     ,metric,value,tserver)
     from program $program$
      wget -O- http://%s:9000/metrics |
      jq --arg node "%s" -r '.[]
       |select(.type=="tablet")
       |.attributes.table_id+"\t"+.id
       +"\t"+.attributes.namespace_name
       +"\t"+.attributes.table_name
       +"\t"+(.metrics[]|select(.value>0)
       |(.name+"\t"+(.value|tostring)))
       +"\t"+$node
       '
     $program$
    with (rows_per_transaction 0)
   $copy$,tserver.host,tserver.host);
   end loop;
 end;
$do$;

-- aggregate the per-tablet row insertion metrics:

select sum(value),format('%I:%I',namespace,table_name)
from my_tablet_metrics where metric='rows_inserted'
group by 2 order by 1
;
I use a server-side COPY FROM PROGRAM here, so you must have installed wget to read from the http endpoint and jq to transform the JSON structure to a tab-separated text.
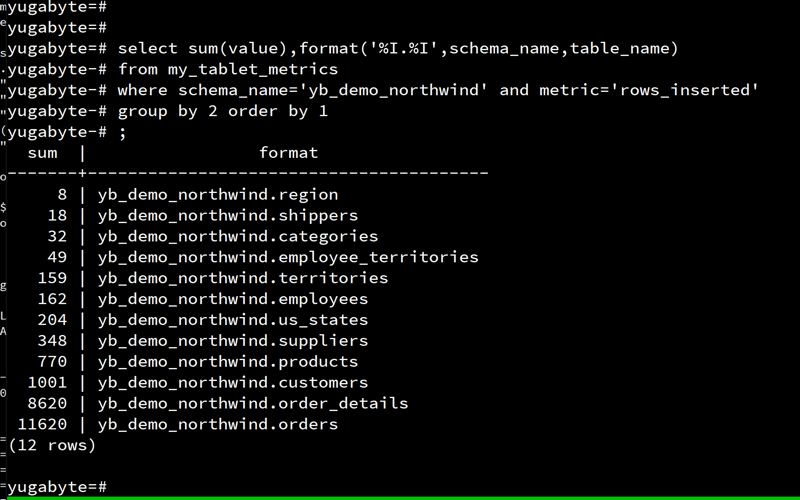
Here is an example after loading the Northwind demo schema:
You may prefer the version out of the database with the list of tserver nodes in the for list:
for s in yb{1..2}.pachot.net # <<-- list of nodes
do
      wget -qO- http://$s:9000/metrics |
      jq --arg node "$s" -r '.[]
       |select(.type=="tablet")
       |.attributes.table_id+"\t"+.id
       +"\t"+.attributes.namespace_name
       +"\t"+.attributes.table_name
       +"\t"+(.metrics[]|select(.value>0)
       |(.name+"\t"+(.value|tostring)))
       +"\t"+$node'
done | awk '
/rows_inserted/{s[$3":"$4]=$(NF-1)+s[$3":"$4]}
END{for(i in s)printf "%15d %s\n",s[i],i}
' | sort -n
COPY in parallel
Ideally, you have generated a pg_dump with a format used with pg_restore to run it in parallel jobs. If not, here is how to quickly split into 3 theads:
n=3
for i in {1..3}
do
awk '
# end of data
/^\\.$/{data=0}
# print data only on modulo threads = thread
data==0||(NR%threads+1==thread){print}
# begining of data
/^COPY/{data=NR+1}
' threads=$n thread=$i my_plain_text_dump.sql | psql &
done
time wait
count the rows
On large tables, a COUNT(*) may take long and fail on timeout. Of course, you can increase the timeout but the easiest to get an idea of the number of rows is to ANALYZE the tables and query the statistics:
do $$ declare r record; begin for r in (
select schemaname,relname,n_live_tup,last_analyze,analyze_count
from pg_stat_user_tables where last_analyze is null
) loop
execute format('analyze %I.%I',r.schemaname,r.relname);
end loop;
end; $$ ;

select schemaname,relname,n_live_tup,last_analyze,analyze_count
 from pg_stat_user_tables where last_analyze is not null order by 1,2;

 schemaname | relname | n_live_tup |         last_analyze          | analyze_count
------------+---------+------------+-------------------------------+---------------
 public     | orders  |   47653008 | 2021-10-29 18:39:13.788017+00 |             1
If you find any issue when loading your PostgreSQL into Yugabyte, please reach out to us (https://www.yugabyte.com/community) there are many things in the roadmap.


