I’ve discovered VisiData when watching Tanel Poder querying the metrics gathered with his 0x.tools. Installing is easy, documented at https://www.visidata.org/install and I just did:
sudo yum install -y python3-pip python3-devel postgresql-devel gcc
pip3 install visidata psycopg2 lxml requests
I've added psycopg2 (and then postgresql-devel) because I'll access to a YugabyteDB database which is accessed with the PostgreSQL driver as it is fully compatible (protocol, SQL and PL/pgSQL, Open Source license,...) and lxml to read some html directly from their url.
Files
If you run a simple vd you will see the files in your directory. For example, I’m in the directory where I installed YugabyteDB and run vd and see the files in the directories, like this (after typing g_ ) to adjust the width of columns:

JSON - read config
I have a JSON file here and, of course vd can read it (like most data text files as csv, xls, xml, json,...). If I go to version_metadata.json (navigate with arrow keys or h,j,k,l) and hit ENTER I can see the content:
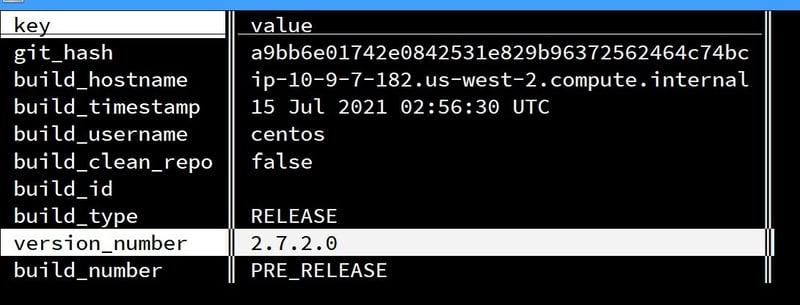
ENTER has opened a new sheet. You can see all sheets with shift-S and there ENTER goes to the sheet (not creating a new one as usual). You can quit a sheet with q and then land into the parent one, and typing q multiple times is a way to quit the program. Many keys look like Vim ones, but no 'Esc' here (and no ':wq' either). You can close all sheets, and then quit the program immediately, with Ctrl-q or gq.
d usually deletes a row, and in the sheet list (Shift-S) it removes the sheet. But you can still find it in the trash bin, visible with gS. The g prefix is a more-global modifier for many commands. For example gj will go to the last row (as G), or g/ whill search on all columns where / searches on the current column. And you go to the last column with gl (the current column is highlighted in the first row). And I have already used g_ where _ would have resized the current column only.
Sheets have a name (e to rename in the sheet list) and a number (ALT and the number goes directly to it)
In case of mistakes, shift-U is the undo and shift-R the redo. But don't worry: you are working on sheets, you are not modifying the original data. You can write the sheet with Ctrl-s. The extension will determine the format.
DB - read SQL data
Reading files is cool, but I can query a database with VisiData. This is why I installed psycopg2, the PostgreSQL driver for Python, which can connect to PostgreSQL or YugabyteDB:
PGOPTIONS="-c random_page_cost=1e42" vd postgres://franck:Yugabyte@yb1.pachot.net:5433/yb_demo_northwind
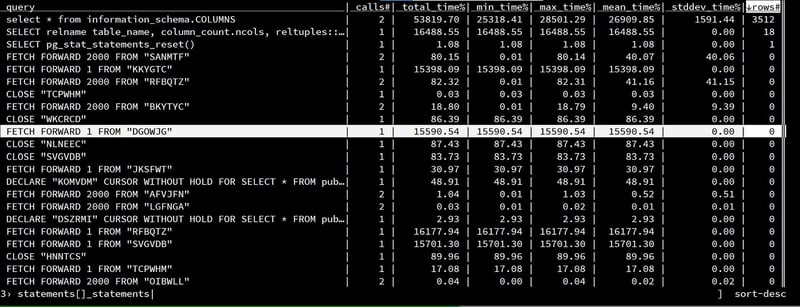
The PGOPTIONS is a workaroud for issue #7745. Especially if you use my connection string above, which goes to a free VM of mine with limited resources. Visidata likes to count the columns for all tables and information_schema.columns is not yet optimized in YugabyteDB. It could be worse - a previous version of VisiData ran a count(*) on all tables thinking this is a fast operation... Anyway, don't panic, when reading data, VisiData is executing optimized queries with DECLARE CURSOR and FETCH FORWARD.
So, with the command above the first sheet is the list of tables in the public schema (or another you set with --postgres-schema). With ENTER on a line it opens a sheet on the table and you can navigate. h and l selects the columns, H and L can move them. And you can pin the key ones on the left with !. I can sort on a column with [ and ]. The column type should be correctly detected but can be changed with ~,#,%,$,@.
I can select rows with s,u,t or with a | search and then " to put them in a new sheet. One function that is really useful is the frequency histogram when, on a column, Shift-F opens a sheet with the distinct value and their frequency percentage.
For example, on the "orders" table, "ship_country" column I get the following:
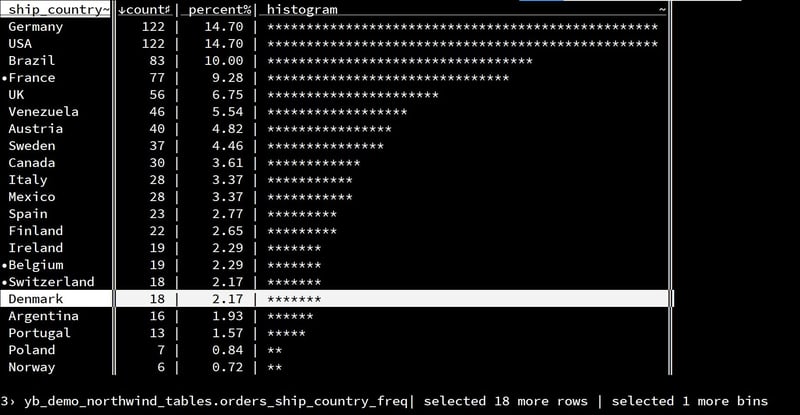
You can see that I selected 3 countries from there and g-ENTER will add a new sheet with all rows filtered on those values.
The frequency can be grouped on multiple columns by adding them as key columns with ! and hit gF to group on it. On the histogram sheet I can also calculate some aggregates with +. There is a nice tutorial here to get further: https://jsvine.github.io/intro-to-visidata/
HTML - Query server info
I use the same tool to query, from the command line, the YugabyteDB metrics that are not exposed in views but html. Here is an example, port 7000 of the yb-master can show the list of servers:
vd +:table_0:0:0 http://yb1.pachot.net:7000/tablet-servers
Here is what I have (after Shift-C to change some column with with e to edit the width value):

JSON - Query tserver metrics
This is for HTML tables but I can also read some JSON info, like the list of YSQL queries from the port tserver 13000:
vd -f json http://yb1.pachot.net:13000/statements
Or metrics from port 9000:
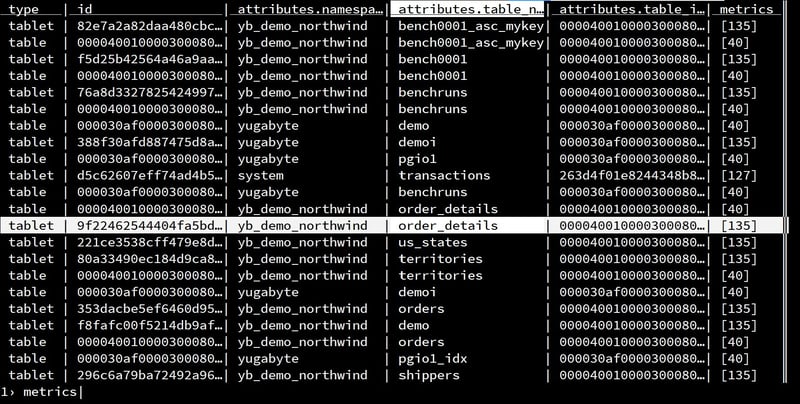
vd -f json http://yb1.pachot.net:9000/metrics
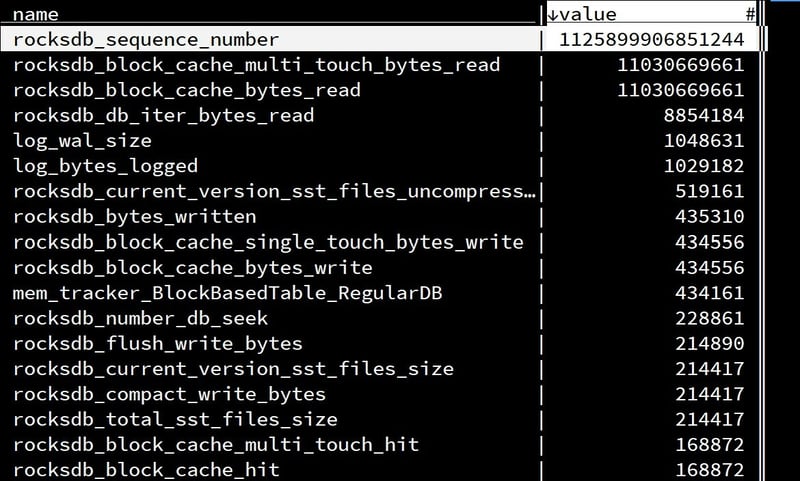
Here is what I see after moving to the "attributes" column with ll and expand it with (. Then one more l to go to "attributes.table_name", search with a regexp with / and then order_details. Then, ENTER, _ to see the full length, l to go to "value", ] to order them:
TEXT- read and search the logs
And I can also read text, so why not get the logs from:
vd http://yb1.pachot.net:9000/logs?raw
That's the occasion to use the split column with a regexp, to extract the "[IWEF]mmdd hh:mm:ss.uuuuuu threadid file:line] msg" information:
;([IWEF])([0-9]+) ([0-9]{2}[:][0-9]{2}[:][0-9]{2}[.][0-9]{6}) ([0-9]+) ([^:]+)(:[0-9]+)
then ENTER and then gL to have the new columns in front.
After renaming the columns with ^ I get this::

Bonus: Statements logs
When I have set statement logging with yugabyted start --tserver_flags="ysql_pg_conf=log_statement='all'" I read them with the following:
awk 'BEGIN{print "Line\tTimestamp\tpid\tstatement"}/LOG:  statement: /{print gensub(/^([0-9-]+ [0-9:]+).[0-9]* [^ ]+ \[([^ ]+)\] LOG:  statement: /,NR"\t\\1\t
\\2\t",1)}' $(awk '$1=="stderr"{print $2}' $(find . -name current_logfiles)) | vd -f tsv
This is just a small set of examples where VisiData is handy. I'll just install it everywhere.
