The previous posts were about setting up an a managed Kubernetes cluster on the Oracle Cloud and installing a YugabyteDB database.
I want to generate some data and network traffic. I'll use my ybdemo container to run some load.
Connect
The connect scenario is just connecting to the YugabyteDB cluster. I provide the yb-tserver-service LoadBalancer endpoint (the hikari.properties connects to yb-tserver-0 and the YBDEMO_DOMAIN adds the kubernetes domain to it). This distributes the connections, but, in addition to that, I'm using the YugabyteDB cluster-aware JDBC driver and the connections are balanced to all pods. I could specify the specific zone in the connection string if I wanted to connect each application server locally.
dev@cloudshell:~ (uk-london-1)$

 kubectl -n yb-demo run ybdemo1 \
 --env="YBDEMO_DOMAIN=yb-tservers" --image=pachot/ybdemo \
 --env="YBDEMO_CASE=connect" --env="YBDEMO_THREADS=10"

pod/ybdemo1 created
The demo program shows where each thread is connected:
dev@cloudshell:~ (uk-london-1)$

 kubectl -n yb-demo logs ybdemo1 | tail

Thread-20   1002 ms: 06-APR 09:46:10 pid:     2618    host:     10.244.0.132
Thread-26   1003 ms: 06-APR 09:46:10 pid:     2652    host:       10.244.0.5
Thread-17   1002 ms: 06-APR 09:46:10 pid:     2610    host:       10.244.0.5
 Thread-8   1003 ms: 06-APR 09:46:10 pid:     2561    host:     10.244.0.132
 Thread-2   1002 ms: 06-APR 09:46:10 pid:     2546    host:       10.244.0.5
Thread-29   1002 ms: 06-APR 09:46:10 pid:     2659    host:     10.244.0.132
 Thread-5   1002 ms: 06-APR 09:46:10 pid:     2647    host:     10.244.0.132
Thread-23   1004 ms: 06-APR 09:46:10 pid:     2629    host:       10.244.1.4
Thread-11   1002 ms: 06-APR 09:46:10 pid:     2595    host:     10.244.0.132
Thread-14   1004 ms: 06-APR 09:46:10 pid:     2607    host:       10.244.1.4
I have 3 pods for the moment, and I see the 3 IP addresses. It is easy to get their hostname to check where we are connected:
dev@cloudshell:~ (uk-london-1)$

 kubectl get pods -n yb-demo
 -o custom-columns="IP:.status.podIP,NAMESPACE:.metadata.namespace,NAME:.metadata.name"

IP             NAMESPACE   NAME
10.244.0.4     yb-demo     yb-master-0
10.244.1.3     yb-demo     yb-master-1
10.244.0.131   yb-demo     yb-master-2
10.244.0.132   yb-demo     yb-tserver-0
10.244.1.4     yb-demo     yb-tserver-1
10.244.0.5     yb-demo     yb-tserver-2
10.244.0.133   yb-demo     ybdemo1
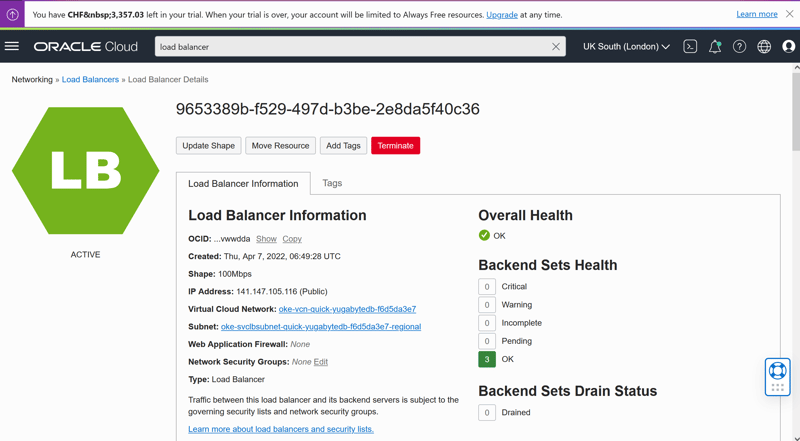
With this configuration, one LoadBalancer redirects to any pod across my 3 Availability Domains. This load balancer is visible from the OCI console, but is managed by OKE:
Create
In order to do some reads and writes, I create a demo table with the init scenario:
dev@cloudshell:~ (uk-london-1)$

 kubectl -n yb-demo run ybdemo0 --image=pachot/ybdemo \
 --restart=Never --env="YBDEMO_DOMAIN=yb-tservers" \
 --env="YBDEMO_CASE=init" --env="YBDEMO_THREADS=1"

pod/ybdemo0 created
The logs show the commands that have been run:
dev@cloudshell:~ (uk-london-1)$

 kubectl -n yb-demo logs ybdemo0

drop table if exists demo;
ysqlsh:/dev/stdin:1: NOTICE:  table "demo" does not exist, skipping
DROP TABLE
create table if not exists demo(id bigint generated by default as identity, ts timestamptz default clock_timestamp(), message text, u bigint default 0, i timestamptz default clock_timestamp(), primary key(id hash));
CREATE TABLE
insert into demo(message) select format('Message #%s',generate_series(1,1000));
INSERT 0 1000
select format('All good :) with %s rows in "demo" table ',count(*)) from demo;
                   format
---------------------------------------------
 All good :) with 1000 rows in "demo" table
(1 row)
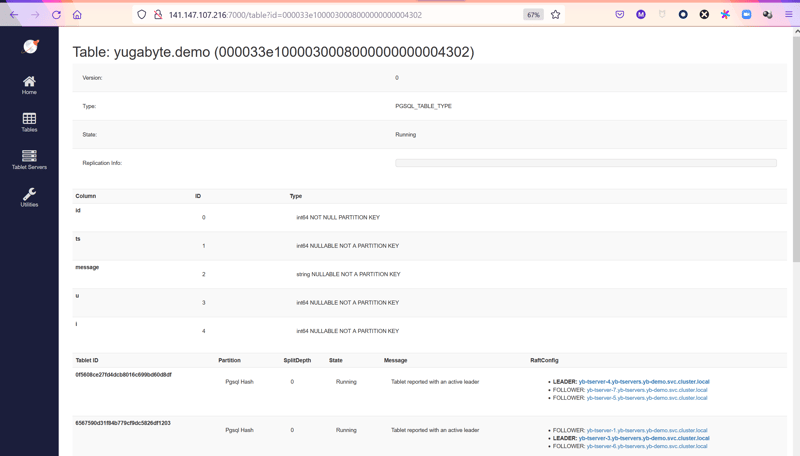
If you want to check the tablets, the console displays them:
Inserts
I have a scenario that insert rows, and I'll run it from 3 pods with 300 threads each:
dev@cloudshell:~ (uk-london-1)$

 kubectl -n yb-demo run ybdemo2 --image=pachot/ybdemo \
 --env="YBDEMO_DOMAIN=yb-tservers" \
 --env="YBDEMO_CASE=insert" --env="YBDEMO_THREADS=300"

pod/ybdemo2 created

 kubectl -n yb-demo run ybdemo3 --image=pachot/ybdemo \
 --env="YBDEMO_DOMAIN=yb-tservers" \
 --env="YBDEMO_CASE=insert" --env="YBDEMO_THREADS=300"

pod/ybdemo3 created

 kubectl -n yb-demo run ybdemo4 --image=pachot/ybdemo \
 --env="YBDEMO_DOMAIN=yb-tservers" \
 --env="YBDEMO_CASE=insert" --env="YBDEMO_THREADS=300"

pod/ybdemo4 created
The logs show what is inserted, which traces the pod it is inserted from. This is the PostgreSQL backend process for the YugabyteDB session
dev@cloudshell:~ (uk-london-1)$

 kubectl -n yb-demo logs ybdemo2 | tail

Thread-40      9 ms: {"id":91458,"ts":"2022-04-06T09:56:04.397588+00:00","message":"inserted when connected to 10.244.0.5","u":0,"i":"2022-04-06T09:56:04.397596+00:00"}
Thread-45      6 ms: {"id":88799,"ts":"2022-04-06T09:56:04.40014+00:00","message":"inserted when connected to 10.244.0.132","u":0,"i":"2022-04-06T09:56:04.400182+00:00"}
Thread-18     10 ms: {"id":89492,"ts":"2022-04-06T09:56:04.396587+00:00","message":"inserted when connected to 10.244.0.132","u":0,"i":"2022-04-06T09:56:04.396594+00:00"}
Thread-10      7 ms: {"id":88991,"ts":"2022-04-06T09:56:04.39952+00:00","message":"inserted when connected to 10.244.0.132","u":0,"i":"2022-04-06T09:56:04.399529+00:00"}
Thread-33      8 ms: {"id":92627,"ts":"2022-04-06T09:56:04.398597+00:00","message":"inserted when connected to 10.244.0.5","u":0,"i":"2022-04-06T09:56:04.398604+00:00"}
Thread-27      8 ms: {"id":90371,"ts":"2022-04-06T09:56:04.400254+00:00","message":"inserted when connected to 10.244.0.132","u":0,"i":"2022-04-06T09:56:04.400263+00:00"}
Thread-48      8 ms: {"id":91357,"ts":"2022-04-06T09:56:04.40041+00:00","message":"inserted when connected to 10.244.0.132","u":0,"i":"2022-04-06T09:56:04.400418+00:00"}
 Thread-5      8 ms: {"id":92821,"ts":"2022-04-06T09:56:04.40054+00:00","message":"inserted when connected to 10.244.0.132","u":0,"i":"2022-04-06T09:56:04.400549+00:00"}
Thread-32      7 ms: {"id":93503,"ts":"2022-04-06T09:56:04.403381+00:00","message":"inserted when connected to 10.244.0.5","u":0,"i":"2022-04-06T09:56:04.403389+00:00"}
Thread-37      7 ms: {"id":92918,"ts":"2022-04-06T09:56:04.403144+00:00","message":"inserted when connected to 10.244.0.5","u":0,"i":"2022-04-06T09:56:04.403153+00:00"}
Count
When I want to check the throughput I have a count scenario:
dev@cloudshell:~ (uk-london-1)$

 kubectl -n yb-demo run ybdemo5 --image=pachot/ybdemo --env="YBDEMO_DOMAIN=yb-tservers" \
 --env="YBDEMO_CASE=count" --env="YBDEMO_THREADS=1"

pod/ybdemo5 created
Note that it is better to have a range scan index on the timestamp, as the count query filters on the last minute:
yugabyte=# create index demots on demo(ts asc);
CREATE INDEX

/*+ IndexOnlyScan(demo demots) */ select format('Rows inserted in the last minute: %s',to_char(count(*),'999999999')) from demo where ts > clock_timestamp() - interval '1 minute';
The output shows the number of inserts per minute:
dev@cloudshell:~ (uk-london-1)$

 kubectl -n yb-demo logs -f

ybdemo5--------------------------------------------------
----- YBDemo -- Franck Pachot -- 2022-02-06 ------
----- https://github.com/FranckPachot/ybdemo -----
--------------------------------------------------
63 [main] INFO com.zaxxer.hikari.HikariDataSource - HikariPool-1 - Starting...
1672 [main] INFO com.zaxxer.hikari.HikariDataSource - HikariPool-1 - Start completed.
--------------------------------------------------
sql executed in each new connection init:
--------------------------------------------------
prepare ybdemo(int) as select
format('%8s pid: %8s %25s %30s %12s',to_char(now(),'DD-MON HH24:MI:SS')
,pg_backend_pid(),'  host: '||lpad(host,16),cloud||'.'||region||'.'||zone,node_type)
as yb_server, pg_sleep($1/1000)
from (select replace(current_setting('listen_addresses'),'0.0.0.0',host(inet_server_addr())::text) as host) as server
natural left join (select host,node_type,cloud,region,zone from yb_servers()) servers
--------------------------------------------------
input lines will start a thread to execute in loop
--------------------------------------------------

Starting a thread for    select format('Rows inserted in the last minute: %s',to_char(count(*),'999999999')) from demo where ts > clock_timestamp() - interval '1 minute'
 Thread-1   7894 ms: Rows inserted in the last minute:      60744
 Thread-1   6379 ms: Rows inserted in the last minute:      61462
 Thread-1   7890 ms: Rows inserted in the last minute:      60374
 Thread-1   7312 ms: Rows inserted in the last minute:      60264
 Thread-1   7394 ms: Rows inserted in the last minute:      60091
 Thread-1  10202 ms: Rows inserted in the last minute:      56947
Scale out
The beauty of running a distributed database on Kubernetes is that scaling the StatefulSets is sufficient. YugabyteDB rebalances the connections, processing, and data.
The StatefulSets have 3 pods:
dev@cloudshell:~ (uk-london-1)$

 kubectl get statefulsets -n yb-demo -o wide

NAME         READY   AGE   CONTAINERS              IMAGES
yb-master    3/3     66m   yb-master,yb-cleanup    yugabytedb/yugabyte:2.13.0.0-b42,yugabytedb/yugabyte:2.13.0.0-b42
yb-tserver   3/3     66m   yb-tserver,yb-cleanup   yugabytedb/yugabyte:2.13.0.0-b42,yugabytedb/yugabyte:2.13.0.0-b42
This is sufficient for yb-master, the control plane, but yb-tserver will benefit from scaling out. Let's bring them to 9 pods:
dev@cloudshell:~ (uk-london-1)$

 kubectl scale -n yb-demo statefulset yb-tserver --replicas=9

statefulset.apps/yb-tserver scaled
Checking it (after a few minutes):
dev@cloudshell:~ (uk-london-1)$

 kubectl get statefulsets -n yb-demo -o wide

NAME         READY   AGE   CONTAINERS              IMAGES
yb-master    3/3     67m   yb-master,yb-cleanup    yugabytedb/yugabyte:2.13.0.0-b42,yugabytedb/yugabyte:2.13.0.0-b42
yb-tserver   6/9     67m   yb-tserver,yb-cleanup   yugabytedb/yugabyte:2.13.0.0-b42,yugabytedb/yugabyte:2.13.0.0-b42
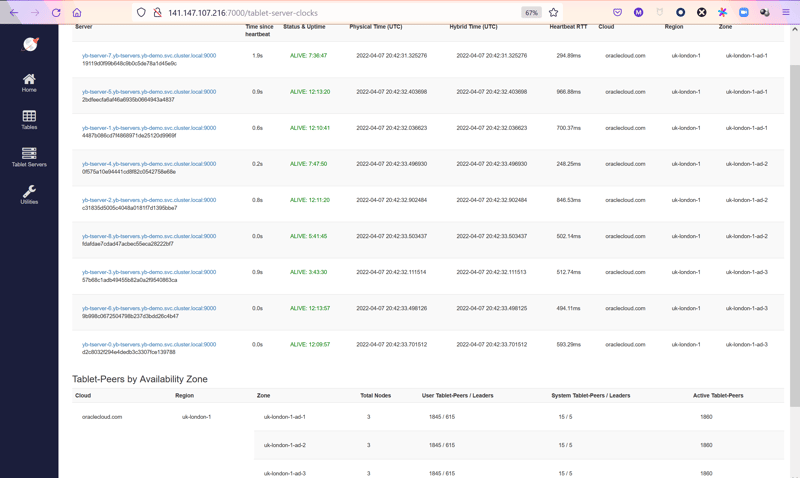
The YugabyteDB database detects automatically the new pods and re-balances the load:
The pods are distributed into the workers, thanks to the anti-affinity property. The workers are distributed to availability nodes by the node pool. The placement definition gives this information to YugabyteDB which re-balances the tablets leader and followers so that the quorum involves the 3 Availability Domains.
Reads
My goal is to generate all kind of traffic. I have a read scenario that queries rows at random within a small work set:
dev@cloudshell:~ (uk-london-1)$

 kubectl -n yb-demo run ybdemo6 --image=pachot/ybdemo --env="YBDEMO_DOMAIN=yb-tservers" \
 --env="YBDEMO_CASE=read" --env="YBDEMO_THREADS=100"

pod/ybdemo6 created
Rolling restart
The high availability of YugabyteDB is not only about infrastructure failures. We can restart the nodes in rolling fashion without interrupting the application. Here is an example:
dev@cloudshell:~ (uk-london-1)$

 kubectl -n yb-demo rollout restart sts yb-tserver --wait

statefulset.apps/yb-tserver restarted
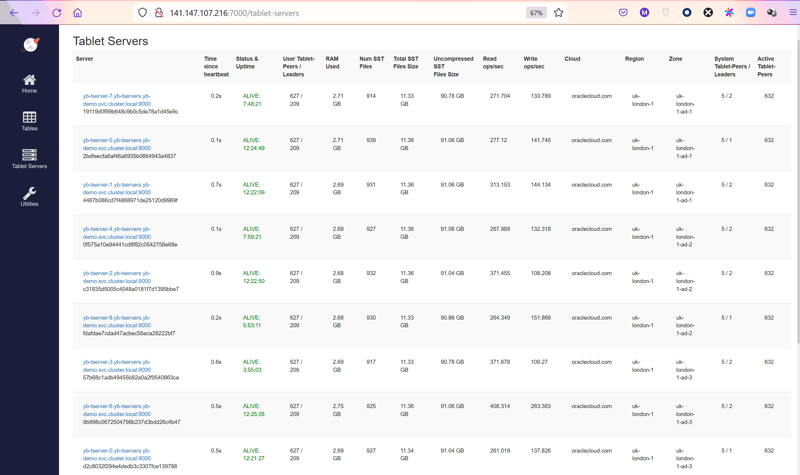
There is nothing more to do on the database side. YugabyteDB detects the nodes that fail, the quorum is still there and the application continues. The tablets that had their leader in the node that restarts have one of their followers becoming the leader. The threads that were connected to this node reconnects thanks to the connection pool and smart driver. When the pod restarts, the node gets the same volume and pulls the missed changes from the other tablet peers to synchronize the followers there. Then, some will be elected leaders to balance the load.
All nodes are busy, with connections, data, and taking reads and writes:
Rolling update
The Helm chart installation defined 4GBbytes memory for the tserver pods:
resource:
  master:
    requests:
      cpu: 2
      memory: 2Gi
    limits:
      cpu: 2
      memory: 2Gi
  tserver:
    requests:
      cpu: 2
      memory: 4Gi
    limits:
      cpu: 2
      memory: 4Gi
Given the worker VMs I have I want to increase it to 32GB.
This is easy with rolling update:
dev@cloudshell:~ (uk-london-1)$

 kubectl -n yb-demo patch statefulset yb-tserver --type='json' -p='[
 {"op": "replace",
  "path": "/spec/template/spec/containers/0/resources/limits/memory",
  "value":"32Gi"},
 {"op": "replace",
  "path": "/spec/template/spec/containers/0/resources/requests/memory",
  "value":"16Gi"}
 ]'
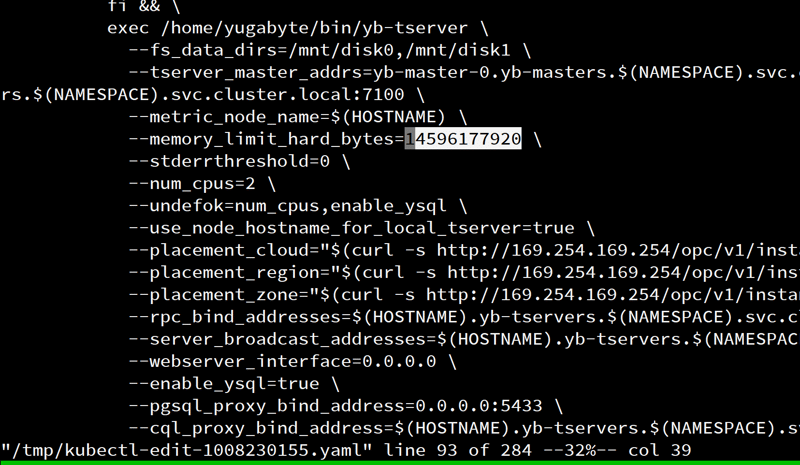
This allows more memory for the container, which are available for connections (the PostgreSQL backend) but I also want the tserver to use more and this is fixed by the yb-tserver command line with --memory_limit_hard_bytes=3649044480 from in the Helm template by --memory_limit_hard_bytes={{ template "yugabyte.memory_hard_limit" $root.Values.resource.tserver }}
I change it to 16GB with kubectl edit sts yb-tserver -n yb-demo:
The containers restart with the new value:
dev@cloudshell:~ (uk-london-1)$

 kubectl edit sts yb-tserver -n yb-demo

statefulset.apps/yb-tserver edited

dev@cloudshell:~ (uk-london-1)$

 kubectl get pods -n yb-demo -w

NAME           READY   STATUS              RESTARTS         AGE
yb-master-0    2/2     Running             0                27h
yb-master-1    2/2     Running             0                27h
yb-master-2    2/2     Running             0                27h
yb-tserver-0   2/2     Running             0                36m
yb-tserver-1   2/2     Running             0                36m
yb-tserver-2   2/2     Running             0                37m
yb-tserver-3   2/2     Running             0                38m
yb-tserver-4   2/2     Running             0                38m
yb-tserver-5   2/2     Running             0                39m
yb-tserver-6   2/2     Running             0                40m
yb-tserver-7   2/2     Running             0                40m
yb-tserver-8   0/2     ContainerCreating   0                2s
ybdemo2        1/1     Running             58 (4m14s ago)   26h
...
Once done, here is how I check the memory from the tserver memtrackers:
dev@cloudshell:~ (uk-london-1)$

 for i in yb-tserver-{0..8}
 do
  kubectl -n yb-demo exec -it $i -c yb-tserver -- \
   curl http://$i:9000/mem-trackers?raw |
  awk '{gsub(/<[/]?td>/," ")}/ (root) /{print n,$0}' n=$i
 done

yb-tserver-0      root  6.38G  6.42G  13.59G
yb-tserver-1      root  6.84G  6.86G  13.59G
yb-tserver-2      root  7.60G  7.63G  13.59G
yb-tserver-3      root  7.34G  7.37G  13.59G
yb-tserver-5      root  1.13G  1.13G  13.59G
yb-tserver-6      root  2.08G  2.24G  13.59G
yb-tserver-7      root  1.75G  2.17G  13.59G
yb-tserver-8      root  1.88G  2.24G  13.59G
Of course, I could have changed the resource spec while editing the StatefulSets and have only one restart.
Terminate demo
If you want to terminate all those demo containers, to start it again, here is a quick loop:
dev@cloudshell:~ (uk-london-1)$

 kubectl get pods \
 -o custom-columns="NAMESPACE:.metadata.namespace,NAME:.metadata.name" \
 -A | grep ybdemo | while read namespace name
 do
  kubectl -n "$namespace" delete pod --force "$name"
 done

warning: Immediate deletion does not wait for confirmation that the running resource has been terminated. The resource may continue to run on the cluster indefinitely.
pod "ybdemo1" force deleted
Uninstall
I'm letting this run to look at the cost after a few days. This will be in the next post. When you want to remove the cluster, you need to delete the resources. The compute instances will be automatically terminated, as they are part of the node pool, but the volumes and load balancers stay if you don't remove them. The instructions are in the install notes displayed at the end of the install.
I let this running and will add more workers. My goal, for the next post, is to look at the cost of this in the Oracle Cloud.
