When you connect to YugabyteDB YSQL (the PostgreSQL compatible API) your session executes the SQL statement from one process (the PostgreSQL backend parsing the query and executing the plan) which reads and writes, by batch of rows, from/to the tablet servers where the rows are distributed.
In some cases, it makes sense to send multiple batches of operations at the same time, so that they are processed in parallel in multiple tablet servers. In some other cases, when those operations return a lot of rows for example, this may not be efficient because those rows will be finally processed by a single process on the SQL layer. In short, scanning in parallel is efficient when combined with the pushdowns of filters and aggregations. Note that the sharding method also matters: if rows are expected to return sorted. This low-level optimization happens only on hash sharded tables from which no specific ordering is expected.
Parallelism level
The number of operations that are executed in parallel is defined by the cluster parameter --ysql_select_parallelism which defaults to -1. With this setting, the parallelism is calculated from the number of tablet servers with min(max(tservers * 2), 1), 16). With a value of
Here is how it decodes:
| ysql_select_parallelism | tserver count | parallelism level |
|---|---|---|
| <0 (default -1) | 1 | 2 |
| <0 (default -1) | 2 | 4 |
| <0 (default -1) | 3 | 6 |
| <0 (default -1) | 4 | 8 |
| <0 (default -1) | 5 | 10 |
| <0 (default -1) | 6 | 12 |
| <0 (default -1) | 7 | 14 |
| <0 (default -1) | 8 or more | 16 |
| 0 | Any | ERROR: Operation list must not be empty |
| >0 | Any | ysql_select_parallelism |
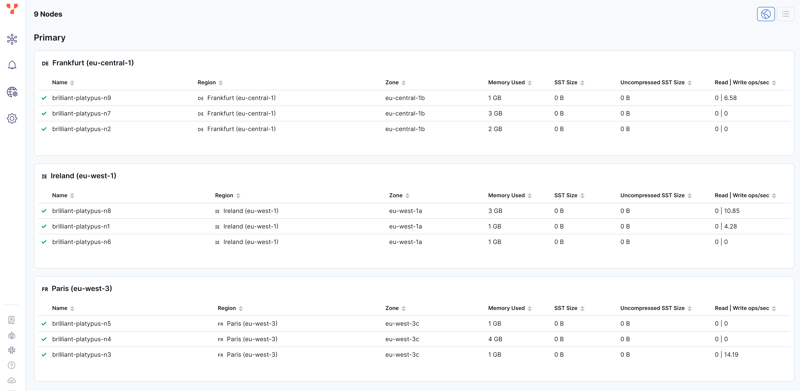
In order to test it I've setup a YugabyteDB Managed cluster with 9 tablet servers:
Example
I'm running this on YugabyteDB 2.18 where this parallelization is done only on hash-sharded tables or indexes (because row ordering may be expected on range sharding), and where there's some pushdown (Partial Aggregate or Remote Filter) for which it makes sense to scan in parallel and return a reduced set to the PostgreSQL backend. This happens in PgGate which is the layer between the PostgreSQL execution plan and DocDB distributed storage. Happening at this level, it is not directly visible from the execution plan. However, the response time gives an idea, and here is an example
with multiple tablets
I'm creating a hash sharded table (the default) with multiple tablets (distributed to multiple tservers) and query with a count() pushdown:
yugabyte=> drop table if exists demo;
DROP TABLE
yugabyte=> create table demo ( id bigint primary key)
           split into 12 tablets;
CREATE TABLE
yugabyte=> insert into demo select generate_series(1,10000000) id;
INSERT 0 10000000

yugabyte=> select yb_table_properties('demo'::regclass)
           , (select count(*) from yb_servers());

 yb_table_properties | count
---------------------+-------
 (12,1,f,,)          |     9
(1 row)

yugabyte=> explain analyze select count(id) from demo;
                                                   QUERY PLAN
----------------------------------------------------------------------------------------------------------------
 Finalize Aggregate  (cost=102.50..102.51 rows=1 width=8) (actual time=1312.134..1312.134 rows=1 loops=1)
   ->  Seq Scan on demo  (cost=0.00..100.00 rows=1000 width=8) (actual time=1312.094..1312.102 rows=12 loops=1)
         Partial Aggregate: true
 Planning Time: 3.059 ms
 Execution Time: 1312.458 ms
 Peak Memory Usage: 64 kB
(6 rows)
The response time is approximately one second to count 10 million rows.
with one tablet
I'm running the same with only one tablet, which leaves no room to parallel scan:
yugabyte=> drop table if exists demo;
DROP TABLE
yugabyte=> create table demo ( id bigint primary key)
           split into 1 tablets;
CREATE TABLE
yugabyte=> insert into demo select generate_series(1,10000000) id;
INSERT 0 10000000

yugabyte=> select yb_table_properties('demo'::regclass)
           , (select count(*) from yb_servers());

 yb_table_properties | count
---------------------+-------
 (1,1,f,,)          |     9
(1 row)

yugabyte=> explain analyze select count(id) from demo;

                                               QUERY PLAN
------------------------------------------------------------------------------------------------------------------
 Finalize Aggregate  (cost=102.50..102.51 rows=1 width=8) (actual time=8298.744..8298.744 rows=1 loops=1)
   ->  Seq Scan on demo  (cost=0.00..100.00 rows=1000 width=8) (actual time=8298.732..8298.735 rows=1 loops=1)
         Partial Aggregate: true
 Planning Time: 0.039 ms
 Execution Time: 8298.819 ms
 Peak Memory Usage: 14 kB
(6 rows)
This has a higher response time and proves that the parallel scan was efficient to reduce the response time. Note that this is different from PostgreSQL Parallel Query which distributes the query processing to multiple backends. Currently, this is disabled in YugabyteDB.


