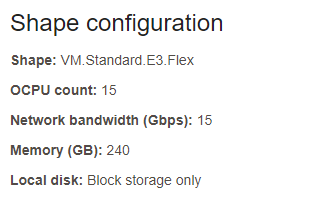
Here is a short blog post where I'm testing different insert batch size on YugabyteDB. I've run this on Oracle Cloud Kubernetes (OKE) and it is the occasion to show how easy it is to setup, run, and estimate costs. I've created a cluster with 3 workers with the following compute shape:
Here are the nodes:
cloud@cloudshell:~ (eu-frankfurt-1)$ kubectl get nodes -o wide

NAME          STATUS   ROLES   AGE   VERSION   INTERNAL-IP   EXTERNAL-IP     OS-IMAGE                  KERNEL-VERSION                      CONTAINER-RUNTIME
10.0.10.120   Ready    node    11m   v1.24.1   10.0.10.120   138.3.250.94    Oracle Linux Server 7.9   5.4.17-2136.311.6.1.el7uek.x86_64   cri-o://1.24.1-76.el7
10.0.10.194   Ready    node    11m   v1.24.1   10.0.10.194   130.61.147.83   Oracle Linux Server 7.9   5.4.17-2136.311.6.1.el7uek.x86_64   cri-o://1.24.1-76.el7
10.0.10.250   Ready    node    11m   v1.24.1   10.0.10.250   130.61.169.65   Oracle Linux Server 7.9   5.4.17-2136.311.6.1.el7uek.x86_64   cri-o://1.24.1-76.el7
cloud@cloudshell:~ (eu-frankfurt-1)$
I create a namespace for YugabyteDB cluster and install it from the Helm chart with the following values:
kubectl create namespace yb-demo

cat > overrides.yaml <<'YAML'
storage:
  ephemeral: false  # will not allocate PVs when true
  master:
    count: 2
    size: 100Gi
    storageClass: "oci-bv"
  tserver:
    count: 2
    size: 100Gi
    storageClass: "oci-bv"
replicas:
  master: 3
  tserver: 12
resource:
  master:
    requests:
      cpu: 2
      memory: 4Gi
    limits:
      cpu: 2
      memory: 4Gi
  tserver:
    requests:
      cpu: 4
      memory: 32Gi
    limits:
      cpu: 4
      memory: 32Gi
gflags:
  master:
    # those sets the placement info from OCI metadata
    placement_cloud: "$(curl -s http://169.254.169.254/opc/v1/instance/regionInfo/realmKey)"
    placement_region: "$(curl -s http://169.254.169.254/opc/v1/instance/regionInfo/regionKey)"
    placement_zone: "$(curl -s http://169.254.169.254/opc/v1/instance/ociAdName)"
  tserver:
    # those sets the placement info from OCI metadata
    placement_cloud: "$(curl -s http://169.254.169.254/opc/v1/instance/regionInfo/realmKey)"
    placement_region: "$(curl -s http://169.254.169.254/opc/v1/instance/regionInfo/regionKey)"
    placement_zone: "$(curl -s http://169.254.169.254/opc/v1/instance/ociAdName)"
    # those are not yet default in the version I used
    ysql_enable_packed_row: "true"
    yb_enable_read_committed_isolation: "true"
YAML

helm install yb-demo yugabytedb/yugabyte --namespace yb-demo \
                                         --wait -f overrides.yaml
I have 12 yb-tserver pods limited to 4 vCPUs, 32GB RAM and 200DB storage:
cloud@cloudshell:~ (eu-frankfurt-1)$ kubectl get sts -n yb-demo -o wide

NAME         READY   AGE    CONTAINERS              IMAGES
yb-master    3/3     4d8h   yb-master,yb-cleanup    yugabytedb/yugabyte:2.15.2.1-b1,yugabytedb/yugabyte:2.15.2.1-b1
yb-tserver   12/12   4d8h   yb-tserver,yb-cleanup   yugabytedb/yugabyte:2.15.2.1-b1,yugabytedb/yugabyte:2.15.2.1-b1

cloud@cloudshell:~ (eu-frankfurt-1)$ kubectl get pod -n yb-demo -o wide

NAME            READY   STATUS    RESTARTS        AGE    IP             NODE          NOMINATED NODE   READINESS GATES
yb-master-0     2/2     Running   0               4d8h   10.244.1.5     10.0.10.120   <none>           <none>
yb-master-1     2/2     Running   0               4d8h   10.244.0.5     10.0.10.194   <none>           <none>
yb-master-2     2/2     Running   0               4d8h   10.244.0.133   10.0.10.250   <none>           <none>
yb-tserver-0    2/2     Running   0               4d8h   10.244.1.3     10.0.10.120   <none>           <none>
yb-tserver-1    2/2     Running   0               4d8h   10.244.0.131   10.0.10.250   <none>           <none>
yb-tserver-10   2/2     Running   0               4d7h   10.244.1.7     10.0.10.120   <none>           <none>
yb-tserver-11   2/2     Running   0               4d7h   10.244.0.135   10.0.10.250   <none>           <none>
yb-tserver-2    2/2     Running   0               4d8h   10.244.0.4     10.0.10.194   <none>           <none>
yb-tserver-3    2/2     Running   0               4d8h   10.244.0.132   10.0.10.250   <none>           <none>
yb-tserver-4    2/2     Running   3 (2d21h ago)   4d8h   10.244.0.6     10.0.10.194   <none>           <none>
yb-tserver-5    2/2     Running   0               4d8h   10.244.1.4     10.0.10.120   <none>           <none>
yb-tserver-6    2/2     Running   0               4d8h   10.244.0.7     10.0.10.194   <none>           <none>
yb-tserver-7    2/2     Running   0               4d8h   10.244.0.134   10.0.10.250   <none>           <none>
yb-tserver-8    2/2     Running   0               4d8h   10.244.1.6     10.0.10.120   <none>           <none>
yb-tserver-9    2/2     Running   2 (2d21h ago)   4d7h   10.244.0.8     10.0.10.194   <none>           <none>

cloud@cloudshell:~ (eu-frankfurt-1)$ kubectl get svc -n yb-demo -o wide

NAME                 TYPE           CLUSTER-IP      EXTERNAL-IP       PORT(S)                                                                      AGE    SELECTOR
yb-master-ui         LoadBalancer   10.96.155.152   129.159.248.92    7000:31025/TCP                                                               4d8h   app=yb-master
yb-masters           ClusterIP      None            <none>            7000/TCP,7100/TCP                                                            4d8h   app=yb-master
yb-tserver-service   LoadBalancer   10.96.20.127    130.162.209.164   6379:31176/TCP,9042:32346/TCP,5433:31696/TCP                                 4d8h   app=yb-tserver
yb-tservers          ClusterIP      None            <none>            9000/TCP,12000/TCP,11000/TCP,13000/TCP,9100/TCP,6379/TCP,9042/TCP,5433/TCP   4d8h   app=yb-tserver
The yb-tserver-service is the load balancer to connect to the PostgreSQL endpoint (YSQL, on port 5433) or Cassandra-like endpoint (YCQL, on port 9042). The yb-master-ui exposes the Web Console on port 7000. I get the URL with this:
kubectl get svc -n yb-demo \
 --field-selector "metadata.name=yb-master-ui"  \
 -o jsonpath='Webconsole:
http://{.items[0].status.loadBalancer.ingress[0].ip}:{.items[0].spec.ports[?(@.name=="http-ui")].port}
'
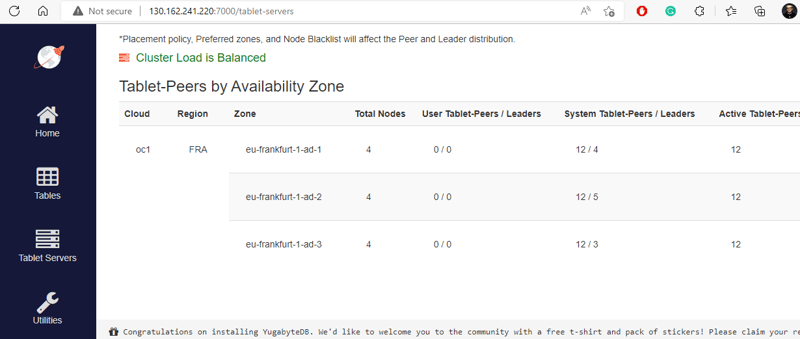
In this console, you can check that the Cloud / Region / Zone are correctly set (I used the OCI metadata) to set the placement info.
Then I set the replication factor to 3 with 1 replica in each Availability Domain:
kubectl -n yb-demo exec yb-master-1 -c yb-master -- yb-admin \
 --master_addresses \
yb-master-0.yb-masters.yb-demo.svc.cluster.local:7100,\
yb-master-1.yb-masters.yb-demo.svc.cluster.local:7100,\
yb-master-2.yb-masters.yb-demo.svc.cluster.local:7100 \
 modify_placement_info \
oc1.FRA.eu-frankfurt-1-ad-1:1,\
oc1.FRA.eu-frankfurt-1-ad-2:1,\
oc1.FRA.eu-frankfurt-1-ad-3:1 \
 3 rw
This can also be set at tablespace level for different placement of tables or partitions.
I get the PostgreSQL endpoint parameters with:
PGUSER=yugabyte PGPASSWORD=yugabyte PGDATABASE=yugabyte
PGHOST=$(kubectl get services -n yb-demo --field-selector "metadata.name=yb-tserver-service"  -o jsonpath='{.items[0].status.loadBalancer.ingress[0].ip}')
PGPORT=$(kubectl get services -n yb-demo --field-selector "metadata.name=yb-tserver-service"  -o jsonpath='{.items[0].spec.ports[?(@.name=="tcp-ysql-port")].port}')
set | grep ^PG
This shows the environment variables to set to connect with a simple psql:
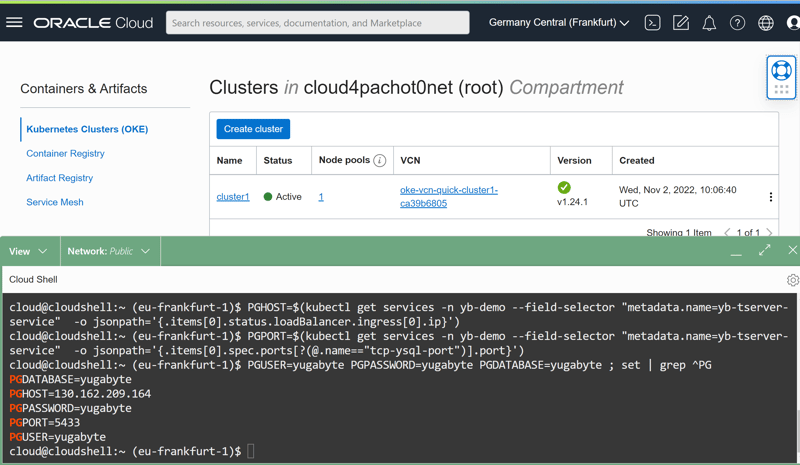 cloud@cloudshell:~ (eu-frankfurt-1)$ PGPORT=$(kubectl get services -n yb-demo --field-selector "metadata.name=yb-tserver-service" -o jsonpath='{.items[0].spec.ports[?(@.name=="tcp-ysql-port")].port}')
cloud@cloudshell:~ (eu-frankfurt-1)$ PGUSER=yugabyte PGPASSWORD=yugabyte PGDATABASE=yugabyte ; set | grep ^PG
PGDATABASE=yugabyte
PGHOST=130.162.209.164
PGPASSWORD=yugabyte
PGPORT=5433
PGUSER=yugabyte
cloud@cloudshell:~ (eu-frankfurt-1)$
"/>
Here are my connection parameters:
PGHOST=130.162.209.164
PGPASSWORD=yugabyte
PGPORT=5433
PGUSER=yugabyte
They connect though the load balancer, and then each connection can end to a different node:
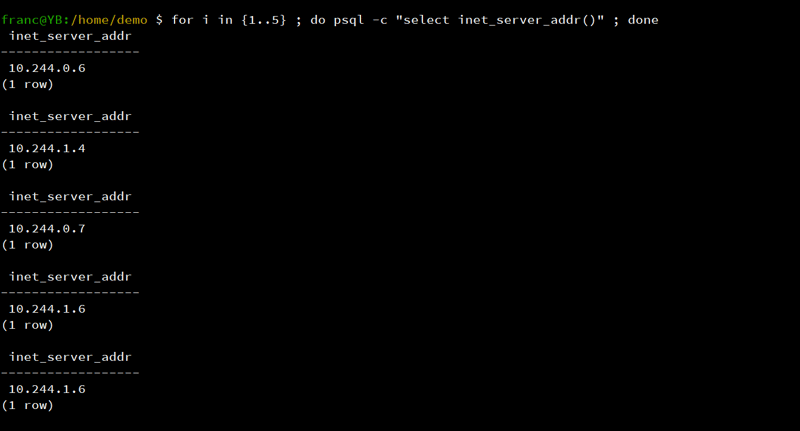
I'll use my old ybio to insert rows in bulk:
git clone git@github.com:FranckPachot/ybio.git
cd ybio
psql -ef ybio.sql
I run the following to insert 100 million rows of 100 to 1000 bytes with a batch size from 1 million to 10 rows:
for rowsize   in {2..3} ; do
for tablets   in {2..3} ; do
echo "Row size: 1e${rowsize}, Tablets: $((8 * $tablets))"
for batchsize in {6..1} ; do
psql -c "
call setup(
 tab_prefix=>'bench_1e${rowsize}_$((8 * $tablets))_1e',
 tab_num=>${batchsize},
 tab_rows=>1e8::int,
 batch_size=>1e${batchsize}::int,
 tab_tablets=>$((8 * $tablets)),
 ind_tablets=>$((8 * $tablets)),
 filler=>1e${rowsize}::int,
 index_as_pk=>true
);
"  2>&1 >/dev/null | awk 'END{print}'
done ; done ; done | tee log.txt
This uses the power of ten for the batch size and use this number in the table name. I output only the last line, the completion one, that shows the total insertion rate.
I'm running with different row size and number of tablets to be sure that I've no side effects. Here is a except with small rows (100 bytes filler) and 16 tablets:
Row size: 1e2, Tablets: 16
NOTICE:  Table bench_1e2_16_1e0006 Progress:  100.00 % (   100000000 rows) at  108213 rows/s
NOTICE:  Table bench_1e2_16_1e0005 Progress:  100.00 % (   100000000 rows) at  115000 rows/s
NOTICE:  Table bench_1e2_16_1e0004 Progress:  100.00 % (   100000000 rows) at   96681 rows/s
NOTICE:  Table bench_1e2_16_1e0003 Progress:  100.00 % (   100000000 rows) at   49054 rows/s
NOTICE:  Table bench_1e2_16_1e0002 Progress:  100.00 % (   100000000 rows) at   15510 rows/s
NOTICE:  Table bench_1e2_16_1e0001 Progress:  100.00 % (   100000000 rows) at    2335 rows/s
This is how I check that the batch size must be higher than 1000 rows when doing bulk inserts, 10000 when having small rows. But this also depends on your environment and the network between the application and the database node you connect to. That's the idea of the post: show that you can quickly test in a lab. Then, what is important is the cost of this lab.
Resources and Cost
During these tests I have homogeneous load on the 3 kubernetes workers in term of CPU utilization:
![CPUUtilization[60m].mean()](https://media.dev.to/cdn-cgi/image/width=800%2Cheight=%2Cfit=scale-down%2Cgravity=auto%2Cformat=auto/https%3A%2F%2Fdev-to-uploads.s3.amazonaws.com%2Fuploads%2Farticles%2F9wugti696mnll7e7dny0.png)
The CPU usage is low, 30% of the 30 vCPU (The worker nodes have 15 OCU which is 15 hyperthreaded Intel cores), so 60% of the cores. This provides the best response time and has enough capacity to accept more tablet leaders in case of an Availability Domain failure.
The memory usage:
![MemoryUtilization[1m].mean()](https://media.dev.to/cdn-cgi/image/width=800%2Cheight=%2Cfit=scale-down%2Cgravity=auto%2Cformat=auto/https%3A%2F%2Fdev-to-uploads.s3.amazonaws.com%2Fuploads%2Farticles%2Flswpze4jzn1cw0htzt8j.png)
Having free memory is necessary, especially for heavy writes, as it is used by the filesystem buffers.
Write I/O:
![DiskBytesWritten[1m].mean()](https://media.dev.to/cdn-cgi/image/width=800%2Cheight=%2Cfit=scale-down%2Cgravity=auto%2Cformat=auto/https%3A%2F%2Fdev-to-uploads.s3.amazonaws.com%2Fuploads%2Farticles%2F0e4su2x5jimqqvonqf21.png)
I suspect an error in this chart, it seems to be cumulated. Looking at the Disk Bytes Written per hour metrics for one node:
The network traffic between Availability Domains is free.
The cost is mostly for the compute instance:
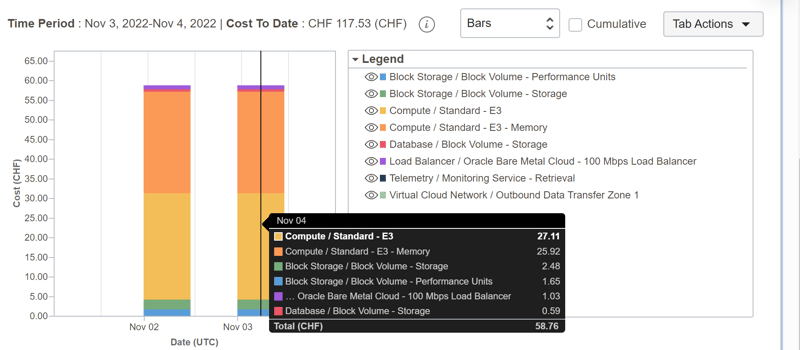
The cost of those 100000 rows inserted per second was 60 USD per day, with a 3 workers highly available kubernetes cluster. It is easy to calculate from the pricing list:
Compute: 0.025 * 24 jours * 15 cores * 3 instances = 27 CHF
GB/hour: 0.0015 * 24 jours * 240 GB * 3 instances = 26 CHF
When you want to stop this lab, you can delete the Kubernetes cluster, but the load balancers and persistent volumes will stay. You can remove them before with:
helm uninstall yb-demo -n yb-demo
kubectl delete pvc --namespace yb-demo --all
kubectl delete namespace yb-demo
![DiskBytesWritten[60m]](https://media.dev.to/cdn-cgi/image/width=800%2Cheight=%2Cfit=scale-down%2Cgravity=auto%2Cformat=auto/https%3A%2F%2Fdev-to-uploads.s3.amazonaws.com%2Fuploads%2Farticles%2Fon4sc3ct401dcyb3y7qx.png)
![DiskBytesRead[1m].mean()](https://media.dev.to/cdn-cgi/image/width=800%2Cheight=%2Cfit=scale-down%2Cgravity=auto%2Cformat=auto/https%3A%2F%2Fdev-to-uploads.s3.amazonaws.com%2Fuploads%2Farticles%2F0n8hady8qytacyaq7nzr.png)
![NetworksBytesOut[1m].mean()](https://media.dev.to/cdn-cgi/image/width=800%2Cheight=%2Cfit=scale-down%2Cgravity=auto%2Cformat=auto/https%3A%2F%2Fdev-to-uploads.s3.amazonaws.com%2Fuploads%2Farticles%2Fqi6c736b752ljb1q3a7f.png)
![NetworksBytesIn[1m].mean()](https://media.dev.to/cdn-cgi/image/width=800%2Cheight=%2Cfit=scale-down%2Cgravity=auto%2Cformat=auto/https%3A%2F%2Fdev-to-uploads.s3.amazonaws.com%2Fuploads%2Farticles%2F2h9d184gsk9z6qg5sfm4.png)


